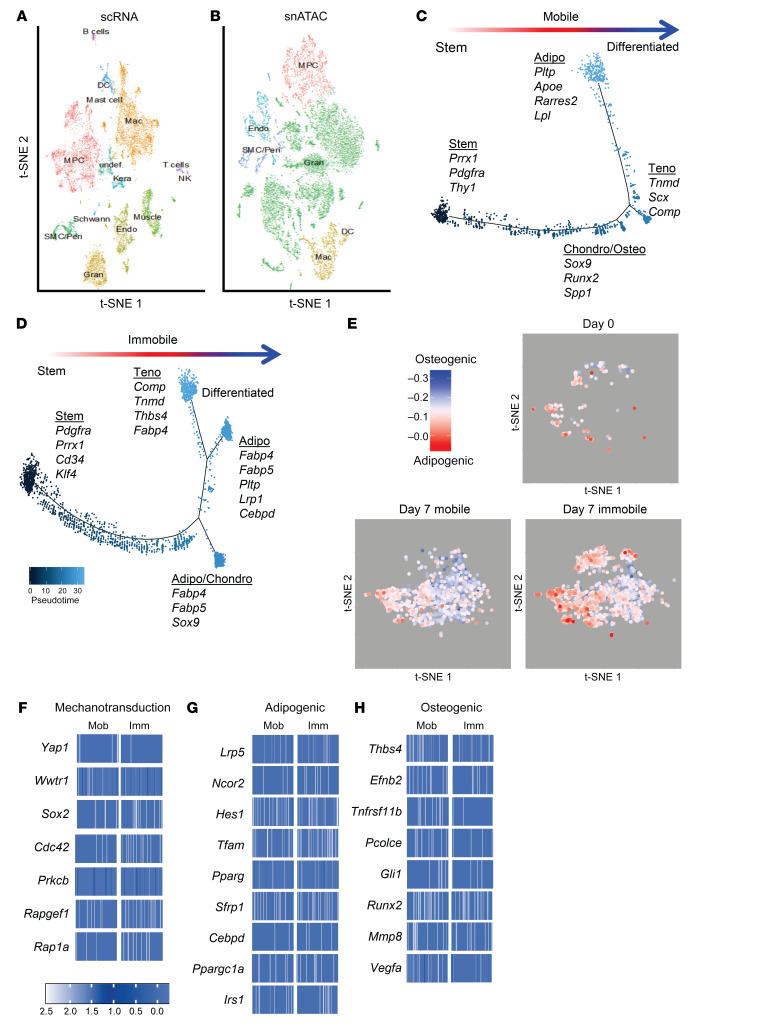
Figure 7. Immobilization results in genetic changes that alter MPC fate.
(A) Canonical correlation analysis of cells from the HO site of day 7 postinjury mobile and immobile mice defines 14 clusters, including an MPC subset. (B) MPCs from scATAC sequencing were identified based on RNA expression in the scRNA-seq results. Trajectory analysis of MPCs from (C) mobile and (D) immobile mice across pseudotime. (E) Adipogenic/osteogenic expression scores calculated on a per MPC basis from the clusters identified in the scRNA-seq analysis of day 0 naive, day 7 mobile, and day 7 immobilized mice. Chromatin accessibility in gene regions specific to the MPC cluster represented by heatmaps of the average log fold change differences in (F) mechanotransduction genes, (G) adipogenic genes, or (H) osteogenic genes compared with locations in other clusters. Heatmaps display the openness in 100 sampled cells from either mobile (Mob) or immobile (Imm) mice that contribute to the MPC cluster from the scATAC-seq analysis.

