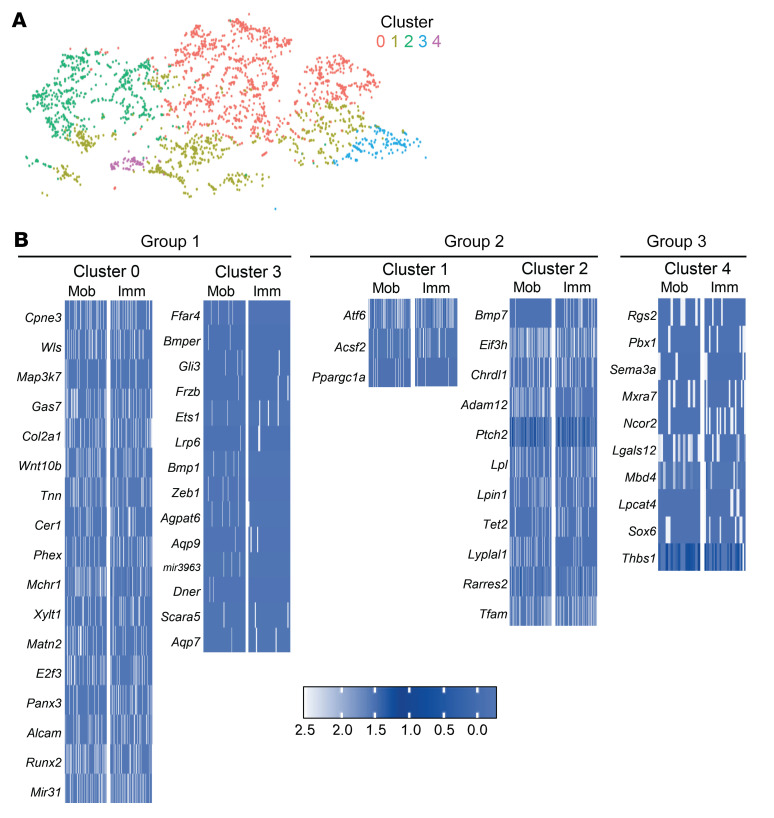
Figure 8. scATAC-seq MPC subclusters reveal distinct MPCs from mobile and immobile mice.
(A) Subcluster analysis of the MPCs from the scATAC-seq results identifies 5 subclusters: group 1 comprises clusters 0 and 3; group 2 comprises clusters 1 and 2; and group 3 comprises cluster 4. On day 0, the number of MPCs in clusters 0–4 was 11, 91, 103, 1, and 30, respectively. In day 7 mobile mice, the number of MPCs in clusters 0–4 was 416, 290, 240, 40, and 27, respectively. In day 7 immobile mice, the number of MPCs in clusters 0–4 was 780, 292, 260, 106, and 17, respectively. (B) Heatmaps representing marker genes for each cluster in groups 1, 2, and 3. Group 1: more Mob MPCs; group 2: mixed Mob and Imm; group 3: more Imm and day 0. Heatmap scale is average log fold change difference in chromatin accessibility between listed cluster compared with other MPC clusters from 100 sampled cells (or number of cells available) from either mobile or immobile mice contributing to each of the MPC subclusters.

