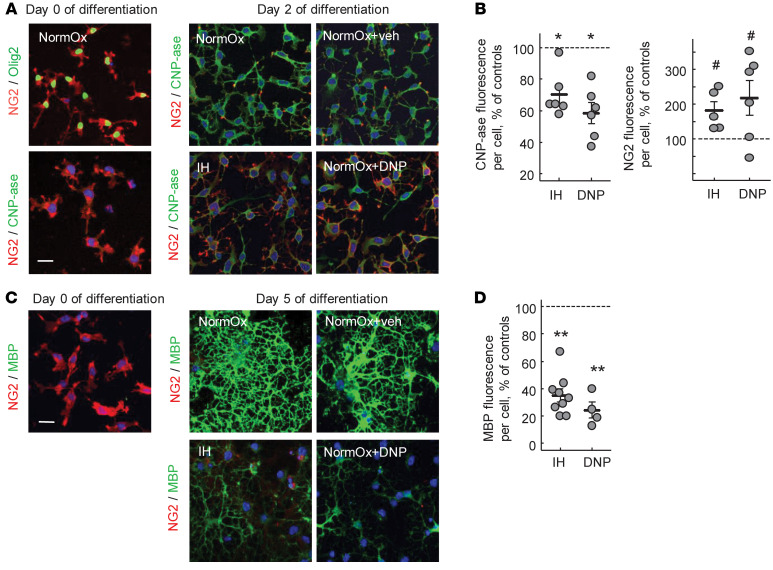
Figure 3. IH or DNP arrests OLs’ maturation.IH or DNP arrests OLs’ maturation.(A) Confocal microscopy of cultured OPCs stained for NG2 and Olig2 (control for OPC purity) and NG2 and CNP-ase before and after 2 days of differentiation under normoxic, IH, or DNP exposures.
Scale bar: 30 μm. (B) CNP-ase– and NG2-specific fluorescence per Dapi+ cell count in the field after 2 days of the OPC differentiation under IH or DNP exposure. Data expressed as the percentage in relation to the fluorescence in the normoxic controls. *P < 0.0005 (1-way ANOVA, Dunnett’s post hoc); #P < 0.01 (Kruskal-Wallis and Dunn’s post hoc tests). (C and D) Images and analysis of MBP fluorescence per cell in the OPCs before and after 5 days of differentiation under normoxic, IH, or DNP exposure. **P < 0.009 (1-way ANOVA, Dunnett’s post hoc test) compared with controls (NormOx). Blue is DAPI; scale bar: 30 μm.

