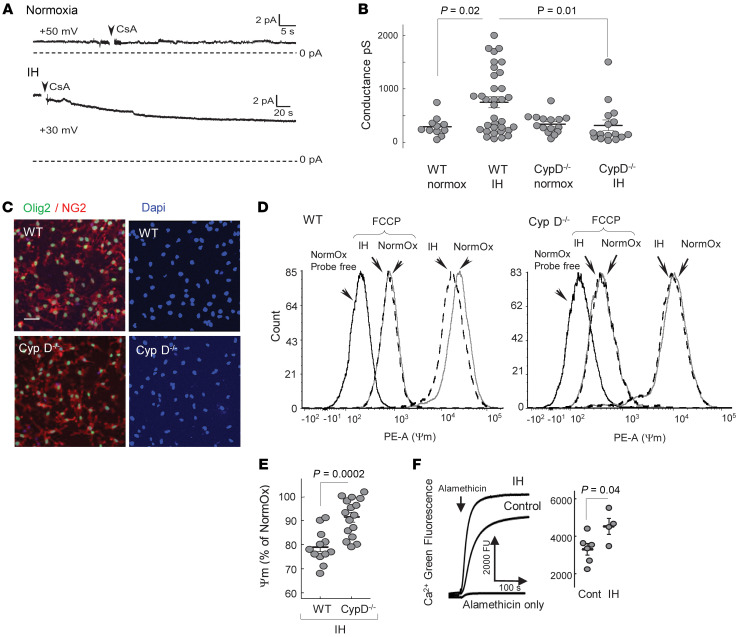
Figure 5. IH activates mitochondrial ion leak.
(A) Ion leak–driven conductance in the mitoplasts from WT OPCs after 2 days of differentiation under normoxia or IH. CsA, 2 μM. pA, picoAmpere. (B) Electrical conductance in mitoplasts isolated from differentiating WT or CypD–/– OPCs after 2 days of maturation under normoxia or IH. Two-way ANOVA with Tukey’s post hoc test. (C) Representative images of OPC primary culture stained for Olig2, NG2, and DAPI showing approximately 92% of Olig2+ cells (values are in the text). Scale bar: 50 μm. (D) Representative tracing of tetramethylrhodamine, ethyl ester (TMRE) fluorescence (ΔΨm) distribution in WT and CypD–/– OPCs after 2 days of differentiation under normoxia (solid line) or IH (dashed line). Left peak is the probe-free control; FCCP-pointing peak is the fluorescence distribution with collapsed ΔΨm. PE-A, phycoerythrin A. (E) ΔΨm as a function of TMRE fluorescence in WT or CypD–/– OPCs after 2 days of differentiation under IH stress. Unpaired t test. (F) Ca2+ fluorescence after alamethicin-induced “piercing” of membranes in subcortical mitochondria isolated from controls and mice after 10 IH episodes with statistical analysis of the Ca2+ fluorescence values at 200 seconds of recording. Unpaired t test.

