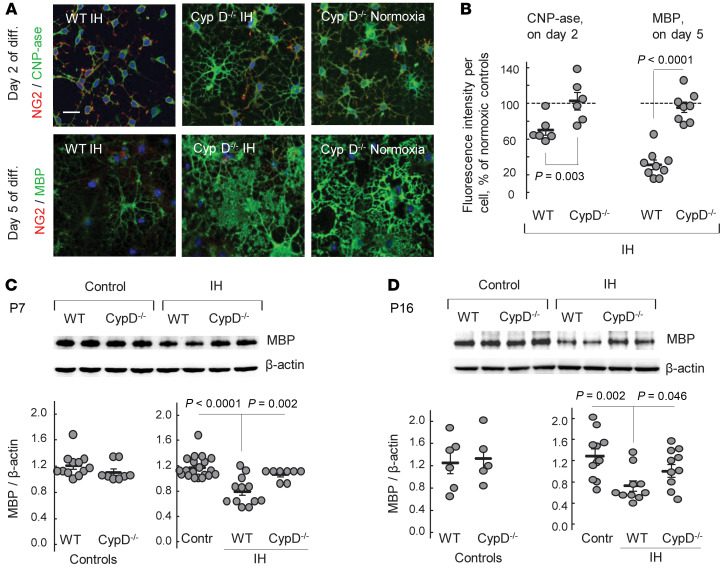
Figure 6. CypD mediates IH-induced arrest of OLs’ maturation.
(A) Confocal microscopy of WT and CypD–/– OPCs stained for NG2 and CNP-ase or NG2 and MBP after 2 or 5 days of differentiation under IH or normoxic conditions. Scale bar: 50 μm. (B) Analysis of the CNP-ase fluorescence per cell after 2 days of maturation and the MBP fluorescence per cell after 5 days of maturation under IH conditions. Data expressed as the percentage in relation to the normoxic genotype-matched controls (100%): CNP-ase (WT n = 6, CypD–/– n = 4) and for MBP (WT n = 9; CypD–/– n = 4). Unpaired t test. (C and D) Cerebral MBP immunoblot images and content in neonatal WT and CypD–/– mice after 7 days of IH exposure (P7) and upon completion (P16) of IH exposure. Because of no difference between WT and CypD–/– controls in the MBP content, both genotypes were combined into a single control group. One-way ANOVA, Dunnett’s post hoc test.

