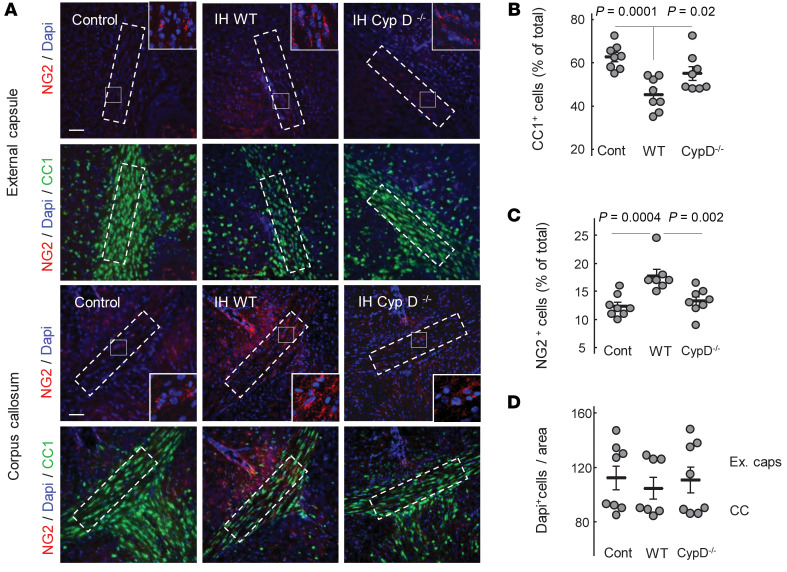
Figure 7. CypD gene KO preserves OLs’ maturation during IH.
(A) Representative images of external capsule and corpus callosum with adjacent tissues obtained upon completion of IH stress and stained for NG2, CC1, and DAPI. Dashed outline represents the frame selected for assessment of cellular count. Scale bar: 100 μm. (B and C) Cellular count expressed as the percentage of total Dapi+ cells. One-way ANOVA, Dunnett’s post hoc test. (D) Dapi+ cell count in the outlined areas of corpora callosa and external capsules.

