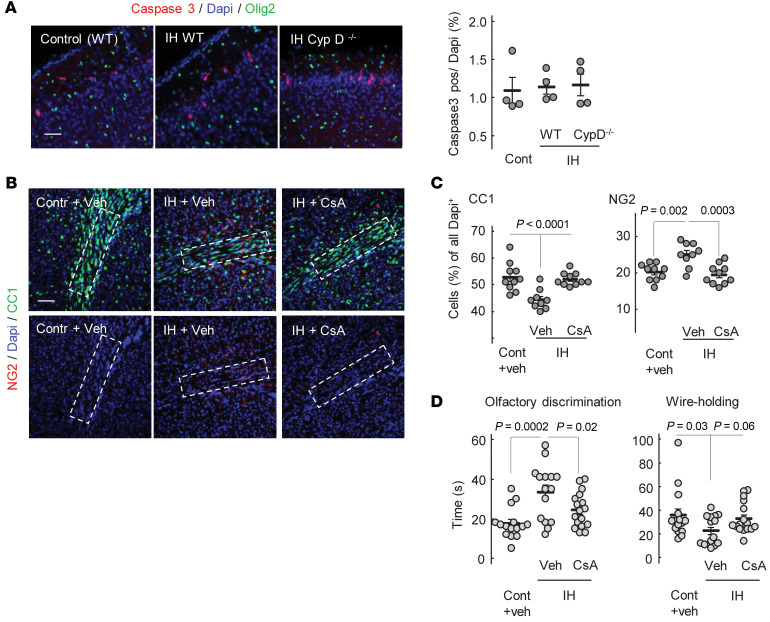
Figure 9. CsA attenuates sensorimotor deficit and preserves OL maturation.
(A) Images of the cortical areas stained for cleaved caspase-3, Olig2, and DAPI with analysis of caspase-3+ cell count relative to all Dapi+ cells in the field. Only fields containing no less than 2 caspase-3+ cells were analyzed (see Methods). Scale bar: 100 μm. (B) Confocal microscopy images of external capsules stained for NG2, DAPI, and CC1 in P16 mice exposed to IH and CsA or vehicle. Outlined areas used for CC1 and NG2 count analysis are shown. Scale bar: 100 μm. (C) CC1 and NG2 cell count in different groups. (D) Sensorimotor performance after IH exposure in the same groups. All analysis done with 1-way ANOVA, Dunnett’s post hoc test.

