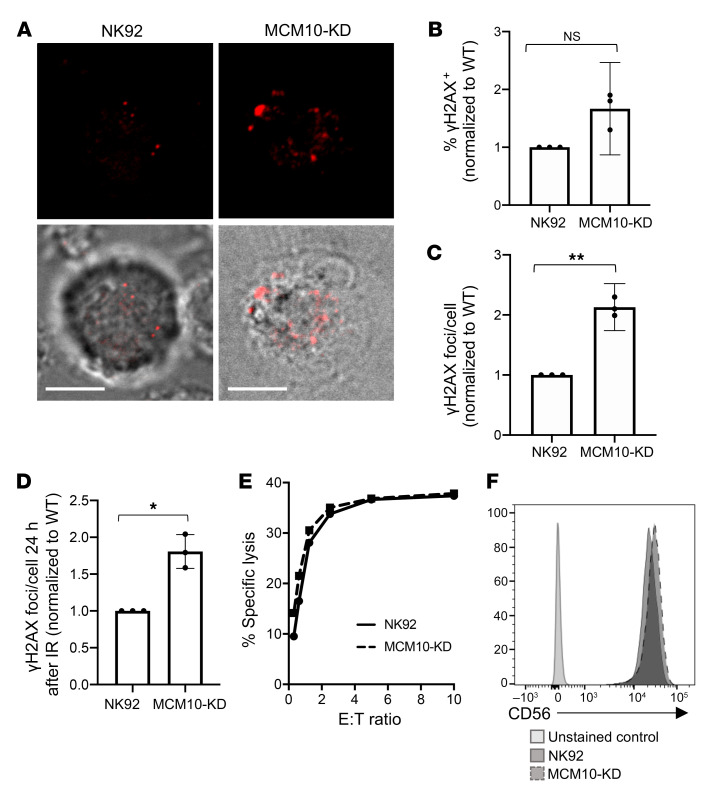
Figure 7. Increased replication stress in an MCM10-KD cell line.
WT or MCM10-KD NK92 cells were fixed, permeabilized, and incubated with anti-γH2AX Alexa Fluor 647. (A) Images were acquired by confocal microscopy. Scale bar: 5 μm. (B) The frequency of cells per field of view that were positive for γH2AX by microscopy was scored by manual counting. Shown are the means from 3 independent replicates performed on different days and normalized to WT NK92. NS, 1-sample t test and Wilcoxon’s test. Data are represented as mean ± 95% CI. (C) The number of γH2AX foci per cell were determined by manual counting of microscopy images. Shown are the means from 3 independent replicates performed on different days and normalized to WT NK92. n = 18–60 cells per condition. **P < 0.01, 1-sample t test and Wilcoxon’s test. Data are represented as mean ± 95% CI. (D) WT NK92 or NK92 MCM10-KD were irradiated with 2 Gy and allowed to recover for 24 hours before fixing and immunostaining for γH2AX. Images were acquired by confocal microscopy, and foci were enumerated by manual counting. Data shown are means from 3 technical replicates performed on different days normalized to WT NK92. n = 10–29 cells per condition. Data are represented as mean ± 95% CI. *P < 0.05, 1-sample t test and Wilcoxon’s test. (E) Cytotoxic function of WT NK92 or MCM10-KD cells against K562 targets was performed by 51Cr release assay. Representative data shown from 3 technical replicates performed on different days. E:T ratio, effector/target ratio. (F) CD56 expression on NK92 (solid line) or MCM10-KD (dashed line) NK92 cells was measured by FACS analysis. Data are representative of 3 technical replicates performed on different days.

