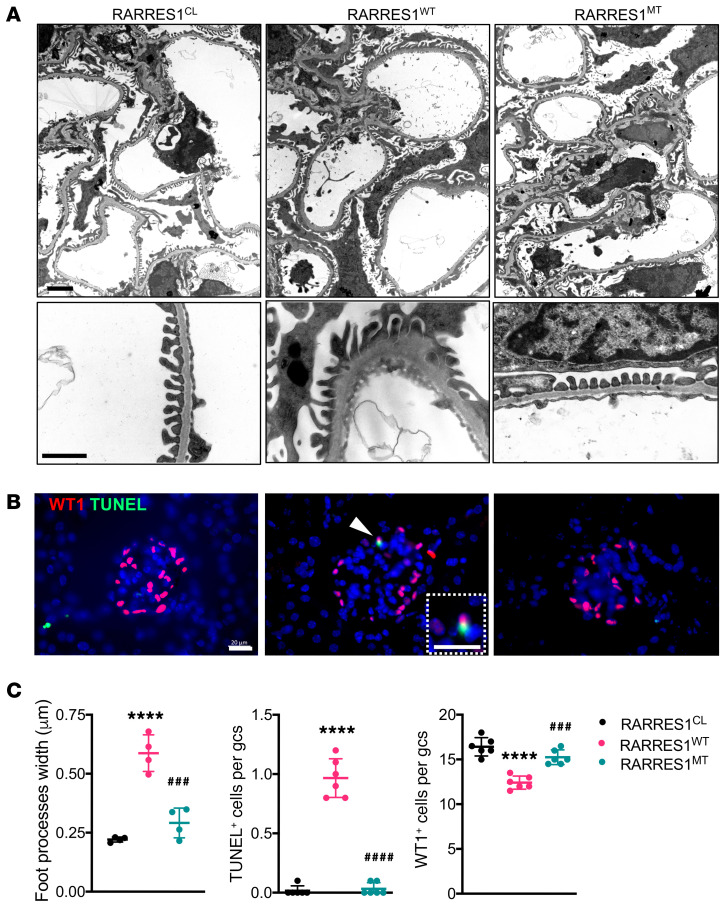
Figure 7. Podocyte overexpression of RARRESWT induces podocyte injury and loss.
(A) Representative transmission electron microscopy images for low and high magnifications. Scale bars: 1 μm. (B) Representative images of WT1 immunostaining (red) and TUNEL staining (green). Scale bars: 20 μm. Arrowhead shows the WT1+ and TUNEL+ cell in RARRESWT kidney, and magnified view is shown in the dotted inset. (C) Quantification of average foot process (n = 4 mice per group evaluated) from transmission electron microscopy images (n = 4 mice per group) and average TUNEL+ and WT1+ cells per glomerular cross section (gcs) per mouse (n = 6 mice per group, 10 glomeruli evaluated for each mouse). All data are represented as mean ± SD. ****P < 0.0001 vs. RARRES1CL; ###P < 0.001 and ####P < 0.0001 vs. RARRES1WT, 1-way ANOVA with Tukey’s multiple comparisons test.

