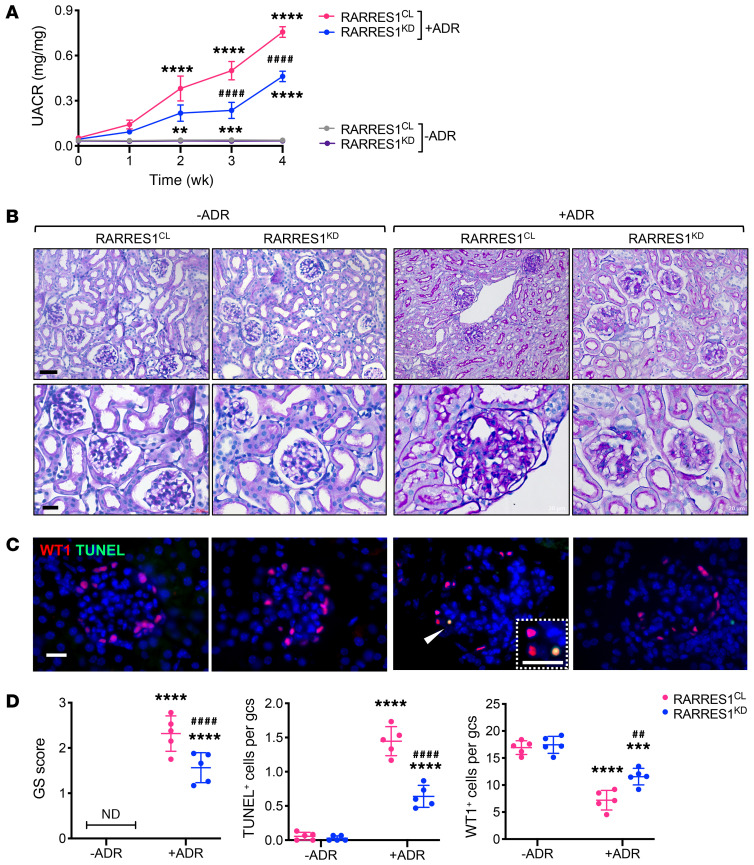
Figure 8. Podocyte Rarres1 knockdown attenuates albuminuria and glomerular injury in ADR-induced nephropathy in mice.
Nphs1-rtTA;TRE-Rarres1KD mice were given either control chow (RARRES1CL) or Dox-supplemented chow (RARRES1KD) for 2 weeks before ADR (+ADR) or vehicle (–ADR) injection. All mice were sacrificed 4 weeks after injection. (A) Urinary albumin-to-creatinine ratio (UACR) after ADR or vehicle injection, where week 0 indicates the baseline before injection. Data are represented as mean ± SEM. n = 5 mice per group. **P < 0.01, ***P < 0.001, ****P < 0.0001 vs. respective –ADR control; ####P < 0.0001 vs. RARRES1CL+ADR by 2-way ANOVA with Tukey’s multiple comparisons test. (B) Representative images of PAS-stained kidneys. Original magnification, ×200 (upper panels); ×400 (lower panels). Scale bars: 20 μm. (C) Representative images of WT1 (red) and TUNEL (green) coimmunostaining. Scale bars: 20 μm. A magnified view of WT1+ and TUNEL+ cells is shown in the inset. Arrowhead shows the colocalization of WT1 and TUNEL cells. (D) Average glomerulosclerosis score per glomerular cross section per mouse (n = 5 mice per group, 25 glomeruli evaluated for each mouse) and TUNEL+ and WT1+ cells per glomerular cross section per mouse (n = 5 mice per group, 15 glomeruli evaluated for each mouse). Data are represented as mean ± SD. ***P < 0.001 and ****P < 0.0001 vs. –ADR control; ##P < 0.01 and ####P < 0.0001 vs. RARRES1CL+ADR, 1-way ANOVA with Tukey’s multiple comparisons test.

