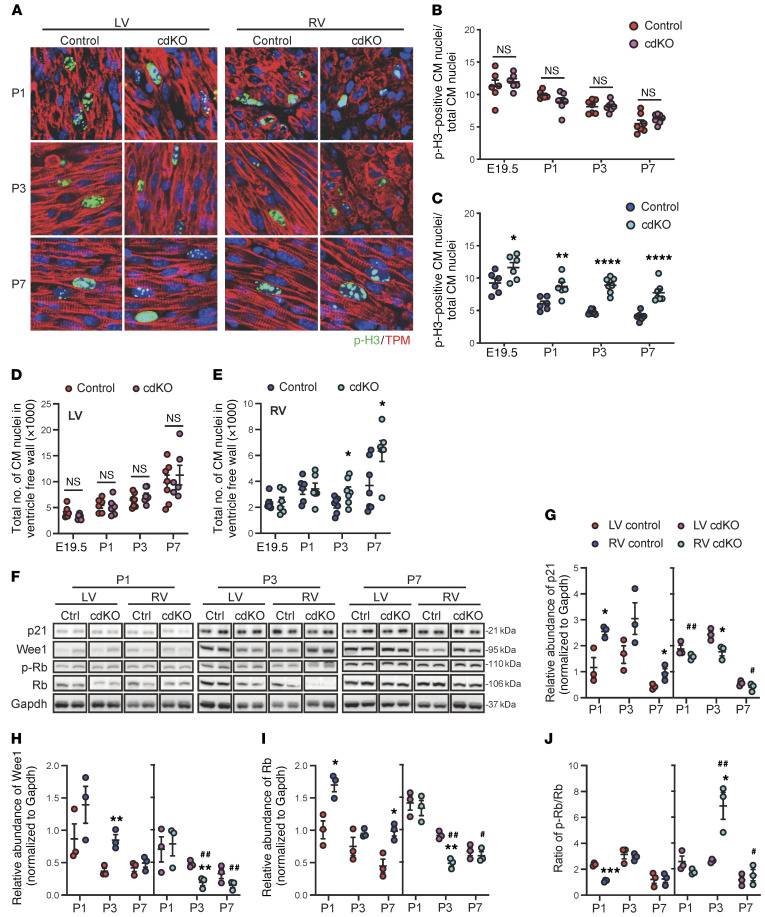
Figure 4. RV-specific impact of p38 MAPK inactivation on cardiomyocyte proliferation in the neonatal heart.
(A) Representative images of p-H3/tropomyosin (TPM) staining of control and p38-cdKO hearts at P1, P3, and P7. Original magnification, ×120. (B and C) Quantification of p-H3–positive cardiomyocyte (CM) nuclei/total CM nuclei/section in the LV (B) and RV (C) from control and p38-cdKO during early postnatal development (control and p38-cdKO n = 6 at E19.5 and P1, n = 7 at P3 and P7; mean ± SEM). (D and E) Total number of CM nuclei/section in the neonatal mouse in LV (D) and RV free wall (E) from control and p38-cdKO at different time points (control and p38-cdKO n = 6 at E19.5 and P1, n = 7 at P3, control n = 7 and p38-cdKO n = 6 at P7; mean ± SEM). (F–J) Representative immunoblots (F) and quantification of protein expression of p21 (G), Wee1 (H), Rb (I), and p-Rb/Rb ratio (J). ****P < 0.0001, ***P < 0.001, **P < 0.01, *P < 0.05 for all panels (LV vs. RV of control or p38-cdKO); ##P < 0.01, #P < 0.05 (control vs. p38cdKO in RV).

