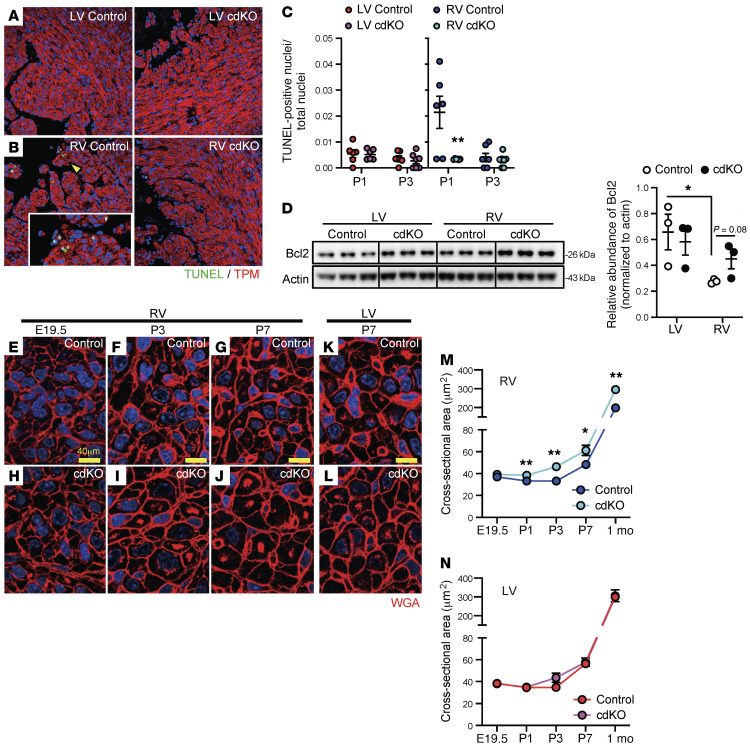
Figure 5. RV-specific effects of p38 MAPK inactivation on cardiomyocyte death and hypertrophy.
(A and B) Representative images of TUNEL and tropomyosin (TPM) staining in the LV (A) and RV (B) of the control and p38-cdKO hearts at P1. Original magnification, ×20. Arrowhead indicates area at higher magnification (×60) in the inset. (C) Percentage TUNEL-positive cardiomyocyte nuclei/total cardiomyocyte nuclei (control and p38-cdKO n = 6 at P1 and n = 7 at P3; mean ± SEM). (D) Immunoblot and quantification of the Bcl2 protein level in the neonatal hearts at P1 (n = 3; mean ± SEM). (E–L) Representative images of wheat germ agglutinin (WGA) staining in the RV from control or p38-cdKO hearts at E19.5 (E and H), P3 (F and I), and P7 (G and J) time points, and in the LV from control or p38-cdKO hearts at P7 (K and L). Scale bar: 40 μm. (M and N) Cross-sectional area of cardiomyocytes from the RV (M) and LV (N) during postnatal development (control and p38-cdKO at 1 month n = 3, other groups n = 6; mean ± SEM). **P < 0.01, *P < 0.05 for all panels (control vs. p38-cdKO).

