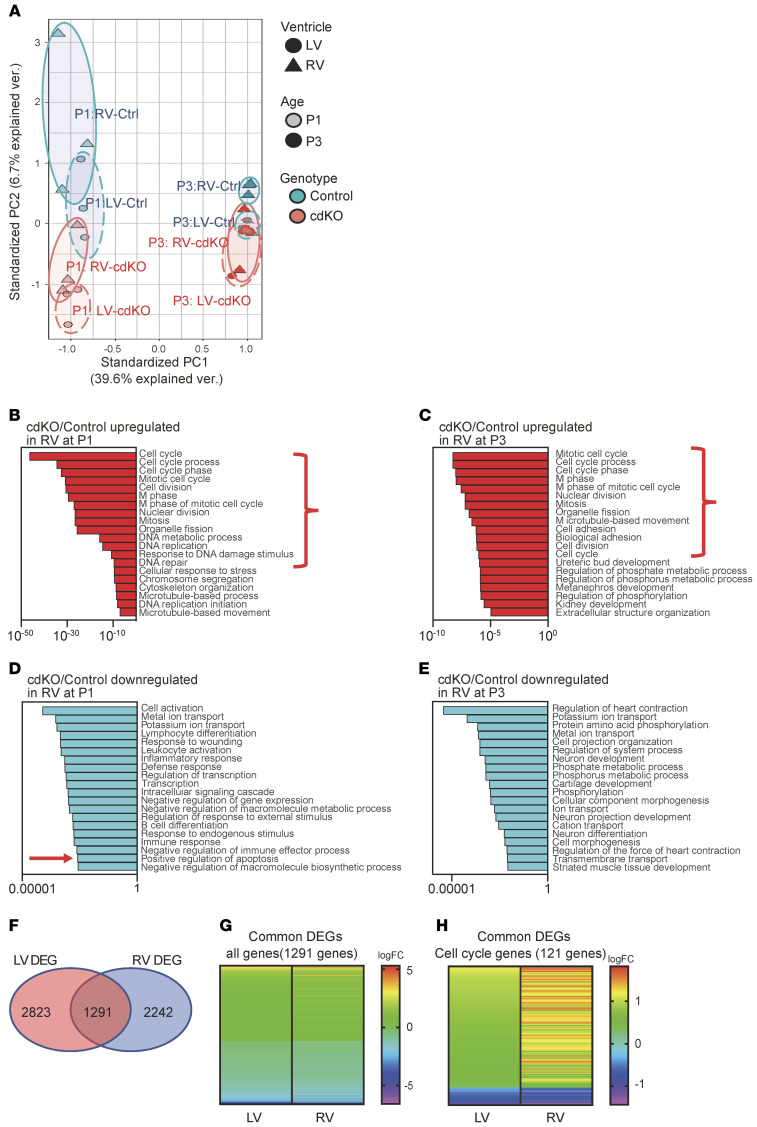
Figure 6. Transcriptome changes in the p38-cdKO heart.
(A) Principal component analysis (PCA) of all expressed genes in the WT (n = 3) and p38-cdKO (n = 3) in the LVs and RVs of hearts at P1 and P3 time points. Circles represent PCA domains from each experimental group as labeled. (B and C) Gene Ontology (GO) classification of upregulated genes in the p38-cdKO RV compared with control at P1 (B) and P3 (C). (D and E) GO classification of downregulated genes in the p38-cdKO RV compared with control at P1 (D) and P3 (E). (F) Venn diagram showing the overlap of differentially expressed genes (DEGs) in p38-cdKO between the LV and RV at P1 (n = 3). (G and H) Heatmaps showing fold changes (logFC) of the DEGs shared by both ventricles at P1 (n = 1,291 genes) (G) and the cell cycle regulatory genes (n = 121 genes) (H).

