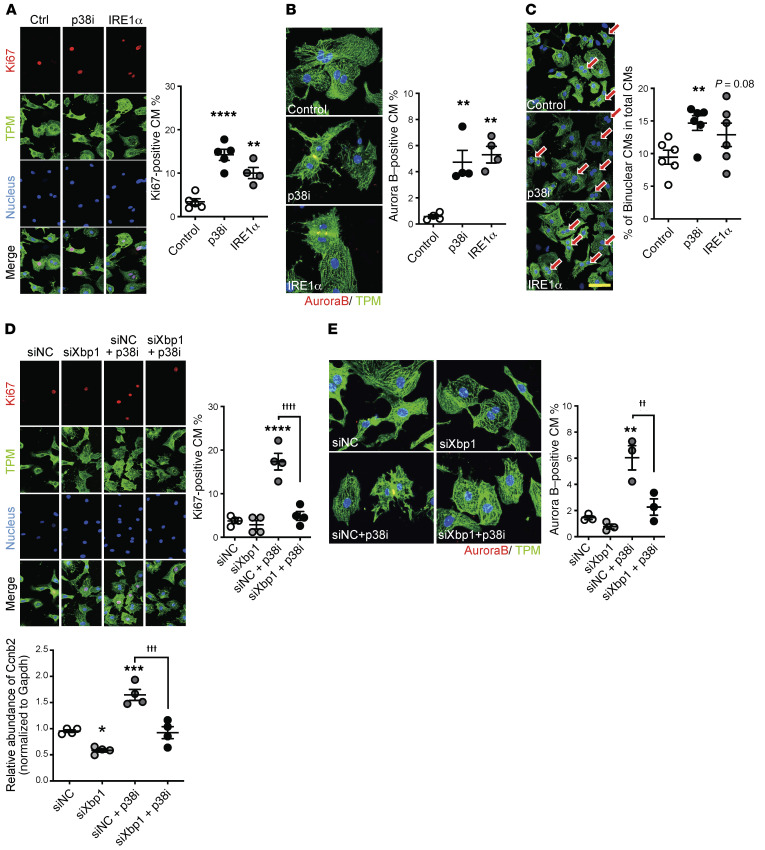
Figure 9. IRE1α/XBP1 and p38 MAPK activity in cardiomyocyte proliferation.
(A) Representative immunohistochemical images and quantification of Ki67-positive, (B) Aurora B–positive, and (C) binucleated NRVMs treated with p38 inhibitor (p38i, SB202190) or Adv-IRE1α (n = 4–6; mean ± SEM). TPM, tropomyosin. (D) Representative immunohistochemistry images/quantification of Ki67-positive and (E) Aurora B–positive NRVMs treated with p38i (SB202190) plus nonspecific (siNC) or Xbp1-specific (siXbp1) silencing (n = 3–4; mean ± SEM). Original magnification, ×60 (A and D) and ×120 (B and E). Scale bar: 50 μm (C). (F) mRNA levels of Ccnb2 (encoding cyclin B2) in NRVMs treated with p38i (SB202190) plus nonspecific (siNC) or Xbp1-specific (siXbp1) gene silencing (n = 4; mean ± SEM). ****P < 0.0001, ***P < 0.001, **P < 0.01, *P < 0.05 (vs. siNC); ††††P < 0.0001, †††P < 0.001, ††P < 0.01 (LV vs. RV, siNC + p38i vs. siXbp1 + p38i).

