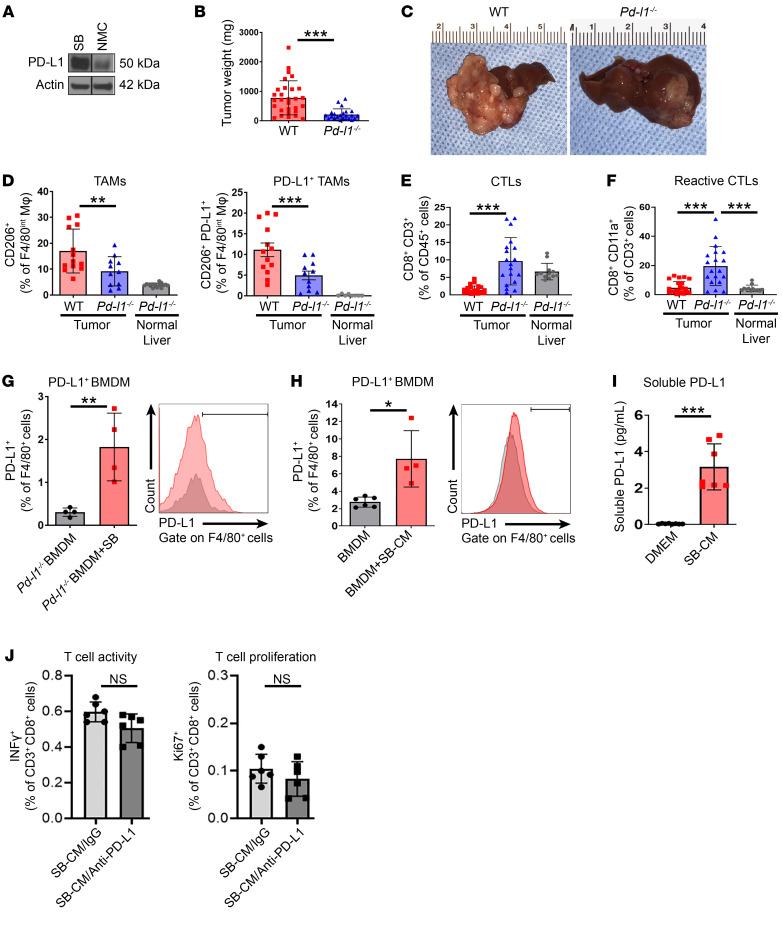
Figure 2. Host PD-L1 contributes to CCA progression.
(A) Immunoblot analysis of PD-L1 in mouse CCA cells (SB) and normal mouse cholangiocytes (NMC). (B–F) Tumor growth of 28 days after orthotopic implantation of 1 × 10⁶ SB cells in WT or Pd-l1–/– mouse livers. (B) Average tumor weights in mg of WT or Pd-l1–/– mice (n ≥ 23). (C) Representative photographs of livers from B. (D) Percentage of CD206+ TAMs (left panel) and CD206+PD-L1+ TAMs (right panel) of F4/80int TAMs (CD45+ CD11b+F4/80in) in Pd-l1–/– normal liver (from mice without tumors) and tumors from WT and Pd-l1–/– mice (n ≥ 8). (E) Percentage of CD8+CD3+ T CTLs of CD45+ cells in Pd-l1–/– normal liver and tumors from WT and Pd-l1–/– mice (n ≥ 12). (F) Percentage of CD8+CD11a+ reactive CTLs of CD45+CD3+ cells in Pd-l1–/– normal liver and tumors from WT and Pd-l1–/– mice (n ≥ 12). (G) Percentage of PD-L1+ F4/80+ BMDMs after 72 hours of coculture in vitro with SB cells (ratio 1:1). BMDMs were isolated from WT mice (n = 4). (H) Percentage of PD-L1+F4/80+ BMDMs after 24 hours of treatment with conditioned medium (CM) from SB cells (1 mL). BMDMs were isolated from WT mice (n = 4). (I) Concentration (pg/mL) of soluble PD-L1 in conditioned medium of SB cells after 24 hours of culture (n = 8). (J) Percentage of INF-γ+ T cells and Ki67+ T cells after 24 hours of treatment with conditioned medium from SB cells (1 mL) with IgG or anti–PD-L1 neutralizing antibody (SB-CM/IgG or SB-CM/anti–PD-L1). T cells were isolated from WT mice (n ≥ 5). Data are represented as mean ± SD. Unpaired Student’s t test (B and G–I) and 1-way ANOVA with Bonferroni’s post hoc test (D–F and J) were used. *P < 0.05; **P < 0.01; ***P < 0.001.

