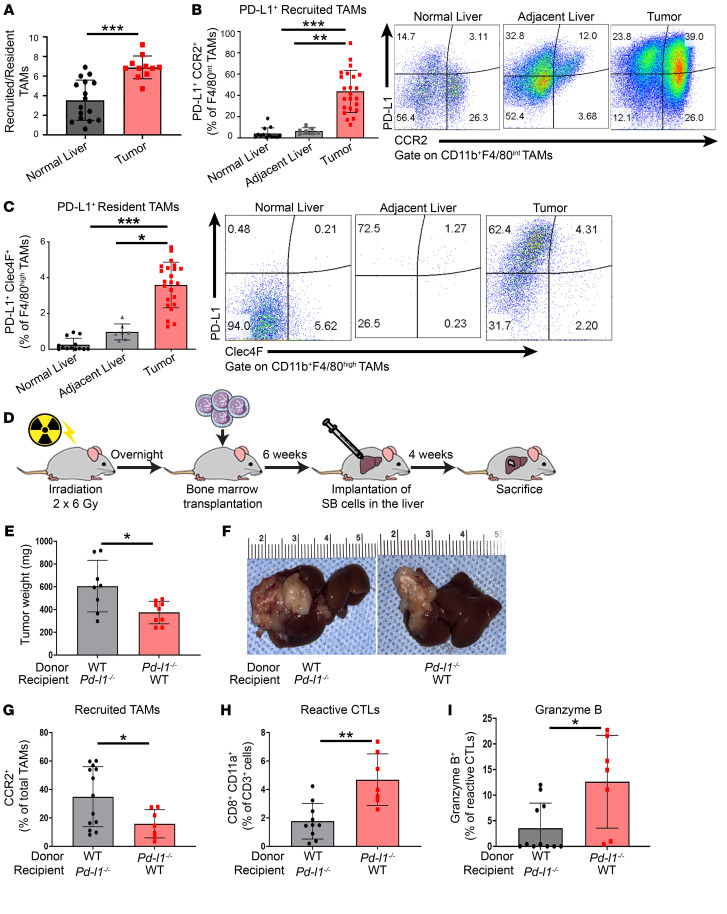
Figure 3. PD-L1+ TAMs are recruited from the BM in CCA.
(A–C and E–I) Tumor growth of 28 days after orthotopic implantation of 1 × 10⁶ SB (murine CCA) cells in WT or Pd-l1–/– mouse livers. (A) Ratio of recruited TAMs (CD45+CD11b+F4/80intCCR2+) to resident TAMs (CD45+CD11b+F4/80hiClec4F+) in WT mouse liver (from mice without tumors) or SB tumor (n ≥ 11). (B) Percentage of PD-L1+CCR2+ recruited TAMs of F4/80int TAMs (CD45+CD11b+F4/80int) in WT mouse liver, tumor-adjacent liver, or tumor. Representative flow plots show expression of CCR2 and PD-L1 in F4/80int TAMs (n ≥ 7). (C) Percentage of PD-L1+Clec4F+ resident TAMs of F4/80hi TAMs (CD45+CD11b+F4/80hi) in WT mouse liver, tumor-adjacent liver, or tumor. Representative flow plots show expression of Clec4F and PD-L1 in F4/80hi TAMs (n ≥ 7). (D) Schematic of mouse BM transplantation. (E) Average tumor weights in mg of Pd-l1–/–mice transplanted with WT BM (WT–Pd-l1–/–) or WT mice transplanted with Pd-l1–/– BM (Pd-l1–/––WT) (n ≥ 8). (F) Representative photographs of livers from E. (G) Percentage of CCR2+ recruited TAMs of total TAMs (CD45+CD11b+F4/80+) in tumors from WT–Pd-l1–/– or Pd-l1–/––WT mice (n ≥ 7). (H) Percentage of CD8+CD11a+ reactive CTLs of CD45+CD3+ cells in tumors from WT–Pd-l1–/– or Pd-l1–/––WT mice (n ≥ 7). (I) Percentage of granzyme B expressed in CD8+CD11a+ reactive CTLs (CD45+CD3+CD8+ CD11a+) in tumors from WT–Pd-l1–/– or Pd-l1–/––WT mice (n ≥ 7). Data are represented as mean ± SD. Unpaired Student’s t test (A, E, and G–I) and 1-way ANOVA with Bonferroni’s post hoc test (B and C) were used. *P < 0.05; **P < 0.01; ***P < 0.001.

