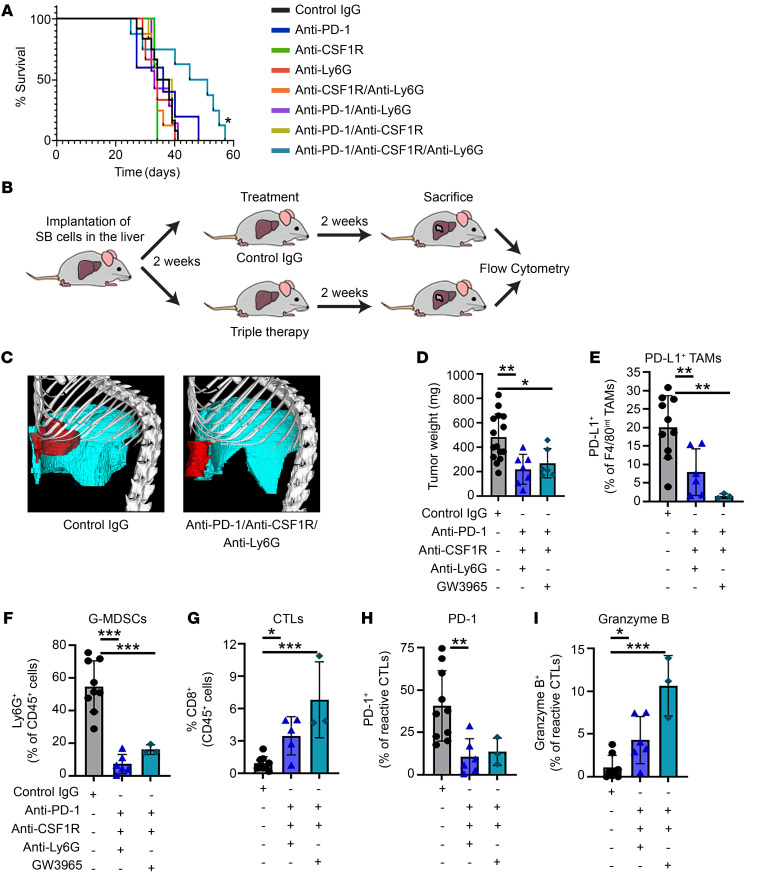
Figure 8. Dual inhibition of G-MDSCs and TAMs potentiates anti–PD-1 therapy.
(A–I) Tumor growth of 28 days after orthotopic implantation of 1 × 10⁶ SB (murine CCA) cells in WT mice. Mice were treated from day 14 to day 28 after implantation. (A) Survival curves in mice treated with control rat IgG isotype, anti–PD-1 (G4), anti-CSF1R (AFS98), anti-Ly6G (1A8), GW3965 alone, or in the depicted combinations (n ≥ 5). (B) Schematic of mouse immunotherapy treatment and characterization. (C) Representative CT image of liver tumor from a contrast reagent–injected mouse treated with control IgG isotype or anti–PD-1+anti-CSF1R+anti-Ly6G 28 days after implantation. The liver is depicted in blue and the tumor in red. (D) Average tumor weights in mg of WT mice treated with control IgG isotype, anti–PD-1+anti-CSF1R+anti-Ly6G, or anti–PD-1+anti-CSF1R+GW3965 (n ≥ 6) (E) Percentage of PD-L1+ TAMs of F4/80int TAMs (CD45+CD11b+F4/80int) in tumors from WT mice treated with control IgG isotype or anti–PD-1+anti-CSF1R+anti-Ly6G or anti–PD-1+anti-CSF1R+GW3965 (n ≥ 3). (F) Percentage of CD11cDimF4/80–CD11b+Ly6G+ G-MDSCs of CD45+ cells in tumors from WT mice treated with control IgG isotype or anti–PD-1+anti-CSF1R+anti-Ly6G or anti–PD-1+anti-CSF1R+GW3965 (n ≥ 3). (G) Percentage of CD8+ CTLs of CD45+ cells in tumors from WT mice treated with control IgG isotype or anti–PD-1+anti-CSF1R+anti-Ly6G or anti–PD-1+anti-CSF1R+GW3965 (n ≥ 3). (H) Percentage of PD-1+ expressed in CD8+CD11a+ reactive CTLs (CD3+CD8+CD11a+) in tumors from WT mice treated with control IgG isotype or anti–PD-1+anti-CSF1R+anti-Ly6G or anti–PD-1+anti-CSF1R+GW3965 (n ≥ 3). (I) Percentage of granzyme B expressed in CD8+CD11a+ reactive CTLs (CD45+CD3+CD8+CD11a+) in tumors from WT mice treated with control IgG isotype or anti–PD-1+anti-CSF1R+anti-Ly6G or anti–PD-1+anti-CSF1R+GW3965 (n ≥ 3). Data are represented as mean ± SD. The log-rank Mantel-Cox test (A) and ANOVA with Bonferroni’s post hoc test (C–H) were used. *P < 0.05; **P < 0.01; ***P < 0.001.

