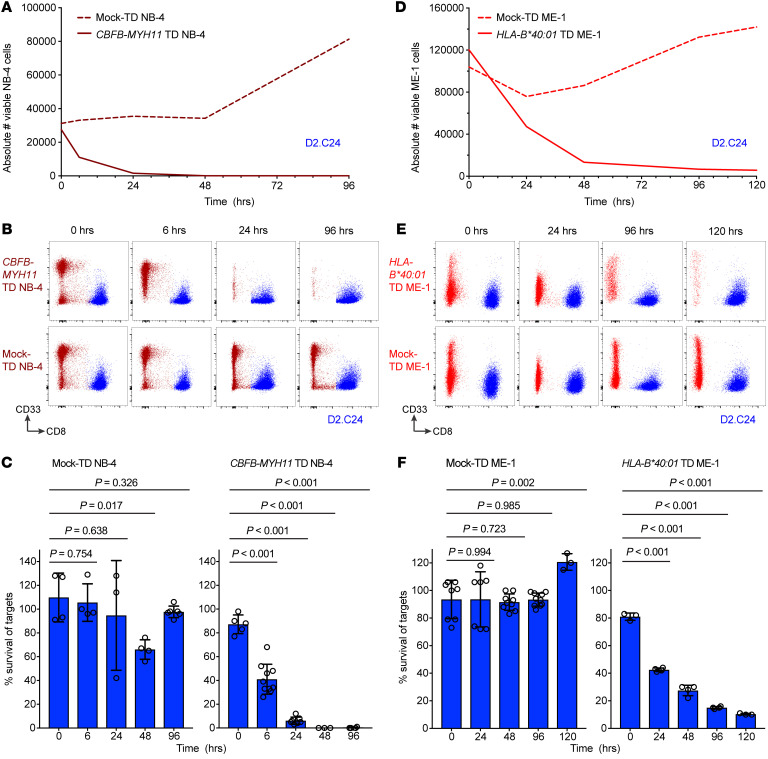
Figure 3. T cells specific for the HLA-B*40:01–restricted CBFB-MYH11 epitope kill AML cell lines.
(A) Absolute cell number of viable NB-4 cells either CBFB-MYH11–transduced (TD) (solid line) or mock-TD (dashed line) after coculture with high-avidity REEMEVHEL-specific clone D2.C24 from a representative experiment. (B) Representative flow plots for experiments shown in A and C, depicting viable single cells at time points after coculture. (C) Percentage survival of NB-4 cells, either WT (left) or transduced to express the full-length CBFB-MYH11 type A fusion (right), at time points after coculture with the D2.C24 T cell clone. (D) Absolute cell number of viable ME-1 cells either HLA-B*40:01–TD (solid line) or mock-TD (dashed line) and cocultured with clone D2.C24 from a representative experiment. (E) Representative flow plots for experiments shown in D and F, depicting viable single cells at time points after coculture. (F) Percentage survival of ME-1 cells, either WT (left) or transduced to express HLA-B*40:01 (right), at time points after coculture with the D2.C24 T cell clone. Viable cell numbers were assessed at varying time points by flow cytometry and percent survival calculated as described in Supplemental Methods. For C and F, colored bars indicate mean and error bars SD for 3–10 technical replicate samples. Two-sample unpaired 2-tailed t tests were performed to compare 0 hours with each subsequent time point.

