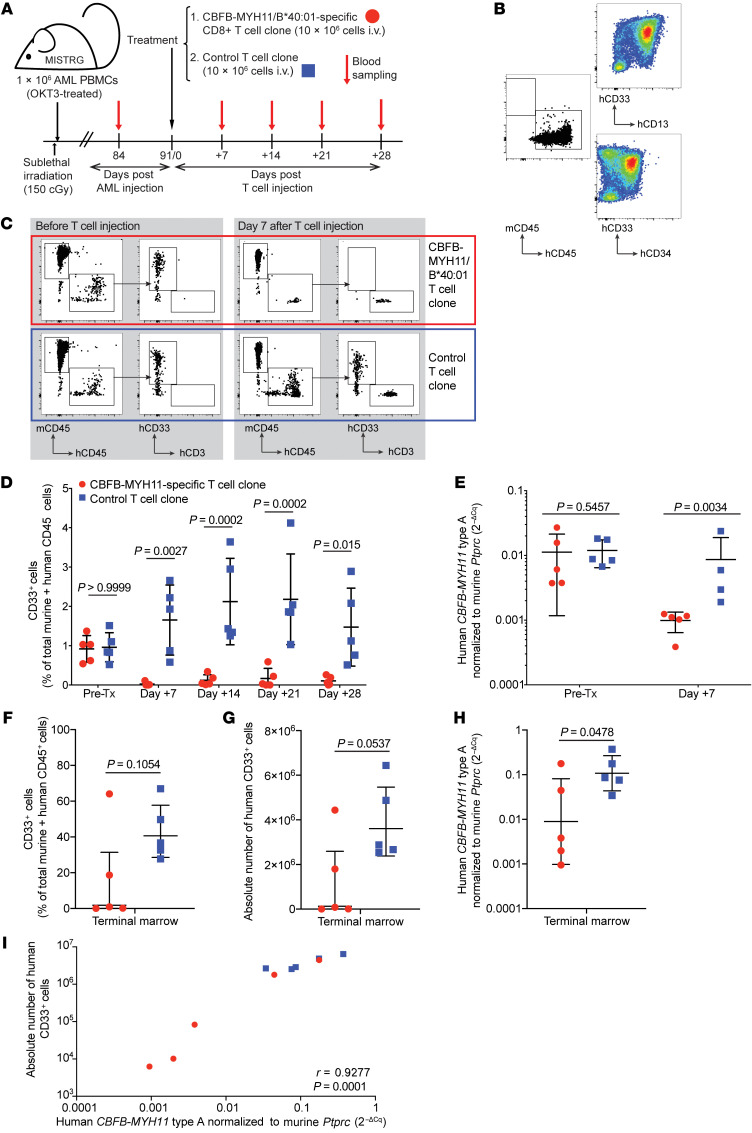
Figure 5. CBFB-MYH11/B*40:01–specific T cells control AML in vivo in a PDX murine model.
(A) Experiment overview: Newborn, preconditioned MISTRG mice were injected intrahepatically with 1 × 10⁶ PBMCs (OKT3-pretreated to prevent xenogeneic graft-versus-host disease) from HLA-B*40:01+ patients with active CBFB-MYH11+ AML. After 12 weeks of AML engraftment, mice received 10 × 106 CD8+ T cells i.v., either D2.C24 clone (high-avidity, CBFB-MYH11/B*40:01–specific) or a control clone (specific for a candidate neoantigen epitope, IPRAHNRLV, presented by HLA-B*07:02, for which this AML was genotypically negative), then were monitored by weekly PB sampling. (B) Primary AML PBMCs (AML1, 81% blasts) before OKT3 treatment and injection into mice were stained for myeloid markers using AML tracking in mice. (C) Representative flow plots of mice PB pretreatment (left) and 7 days after injection (right) with either CBFB-MYH11/B40:01–specific (red box) or control (blue box) T cell clones. (D) Summary of PB disease burden by flow cytometry after CBFB-MYH11/B40:01–specific (red circles) or control (blue squares) T cell treatment. Statistics were calculated using repeated-measures 2-way ANOVA. (E) Human CBFB-MYH11 type A transcript expression, normalized to murine CD45 (Ptprc) as 2–ΔCq, was assessed before and 7 days after administration of CBFB-MYH11/B40:01–specific or control T cells. (F–H) AML burden in terminal bone marrow as percentage (F) or absolute number (G) of human CD33+ cells, and relative CBFB-MYH11 type A transcript expression (H). (I) Correlation between marrow disease burden as measured by flow cytometry and real-time qPCR was determined by calculation of Pearson correlation coefficient. For all groups and time points, n = 5, except for control T cell–treated mice on day 7 (n = 4) owing to poor RNA yield from 1 sample. Except where noted, statistics were calculated using unpaired 2-tailed parametric t tests. Mean and SD are shown.

