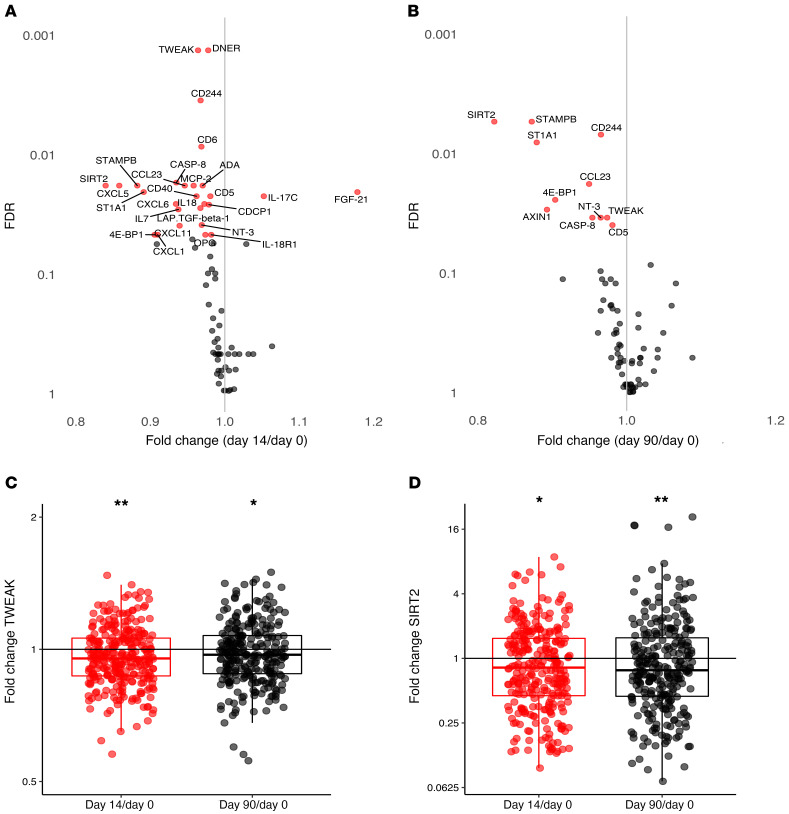
Figure 3. Inflammation after BCG vaccination.
Fold changes in circulating inflammatory markers on day 14 versus baseline (A) and day 90 versus baseline (B). Significant changes compared with baseline are depicted in red, nonsignificant changes are depicted in gray (n = 290-fold change on day 14 versus baseline, n = 275-fold change on day 90 versus baseline; FDR < 0.05 is considered significant). Fold changes in TWEAK (C) and SIRT2 (D) are depicted as examples of significantly decreased circulating inflammatory markers after BCG vaccination (*FDR < 0.05, **FDR < 0.01).

