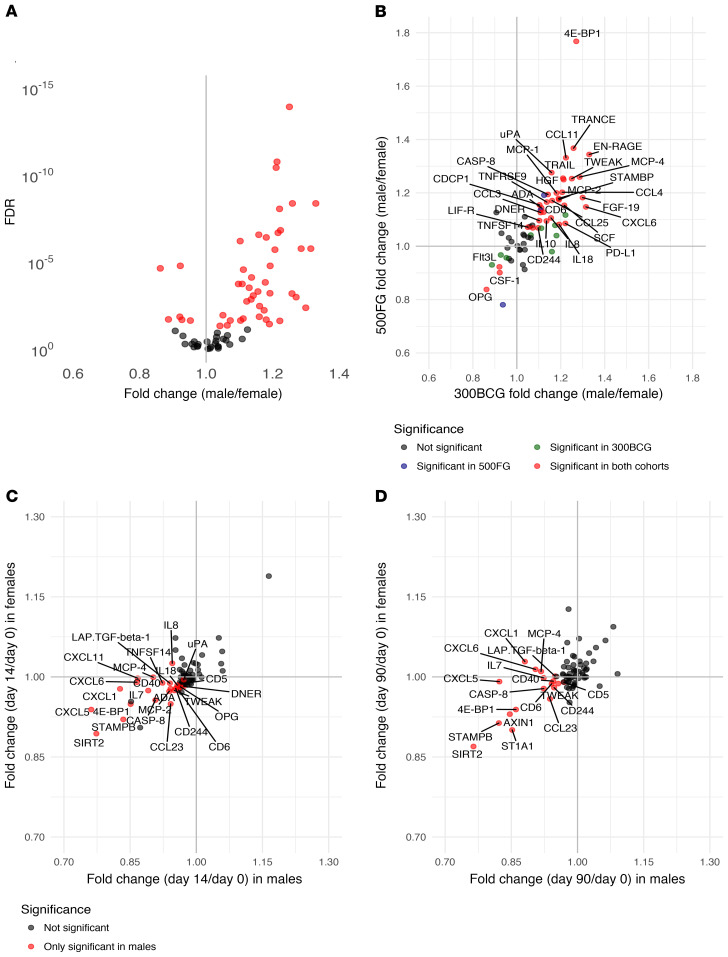
Figure 6. Sex-specific effect of BCG vaccination on systemic inflammation.
(A) Comparison of baseline circulating inflammatory proteins plotted as fold changes between males (n = 132) and females (n = 171). Significant changes between sexes are depicted in red (FDR < 0.05). (B) Comparison of inflammatory proteins between males and females from the discovery cohort (300BCG) were plotted against the comparison between males (n = 215) and females (n = 278) from the validation cohort (500FG). Proteins that were only significantly different in the 300BCG cohort are depicted in green (n = 9), those that were only significant in the 500FG cohort are depicted in blue (n = 3), and the proteins significantly different between males and females in both cohorts are depicted in red (n = 34) and are labeled with their name (FDR < 0.05). Fold changes of circulating inflammatory markers on day 14 versus baseline (C) and day 90 versus baseline (D) in the male-only (n = 132) versus the female-only (n = 171) subset. Significant changes compared with baseline in the male-only subset are depicted in red (FDR < 0.05), and proteins that did not significantly change after BCG vaccination in either the male-only or the female-only subset are depicted in gray. There were no proteins significantly different in the female-only subset.

