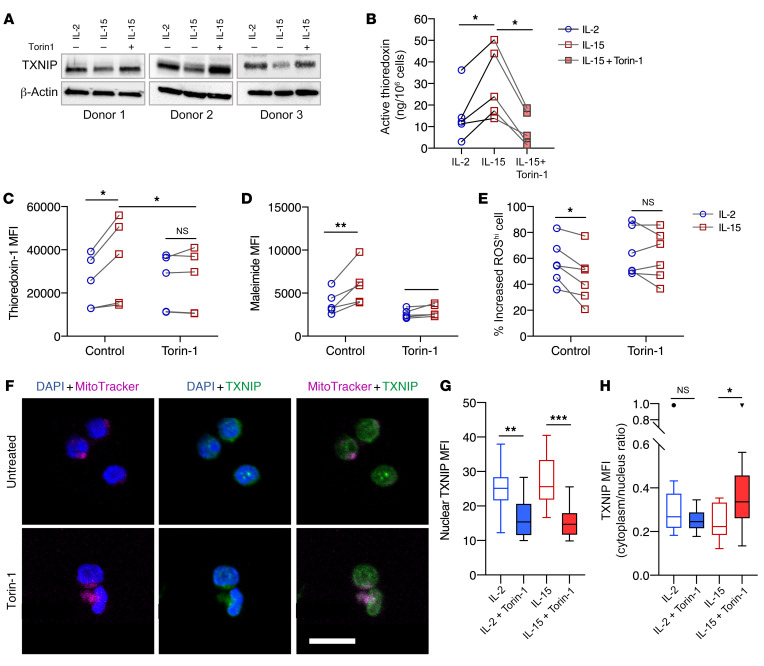
Figure 5. mTOR suppresses TXNIP expression to sustain thioredoxin activity and surface thiol density.
(A) Western blots of TXNIP protein expression in NK cells treated with Torin-1 (n = 3). (B) Concentration of active thioredoxin protein in NK cells primed with either IL-2 or IL-15 or with IL-15 plus Torin-1 treatment (n = 5). (C) MFI of thioredoxin-1 expressed in IL-12– or IL-15–primed NK cells with and without Torin-1 treatment (n = 5). (D) MFI of maleimide staining of IL-12– or IL-15–primed NK cells with and without Torin-1 treatment (n = 5). (E) Relative increased percentage of ROShi NK cells primed with either IL-2 or IL-15 and treated with Torin-1 after exposure to 10 μM H2O2 , compared with NK cells without H2O2 exposure (n = 6). (F) Representative maximum-intensity projections of confocal images (×63 objective) of NK cells treated with 1 mM Torin-1. Blue represents DAPI staining of the nucleus, green represents TXNIP staining, and magenta represents mitochondria staining. Scale bar: 10 μm. (G) MFI of TXNIP (green fluorescence intensity) within the nuclei of NK cells under H2O2 oxidative stress. (H) Image quantification of the cytoplasm/nucleus ratio of TXNIP MFI of NK cells under H2O2 oxidative stress. All individual data points are connected for matching replicates. Data were pooled from 3 biological replicates and are represented as Tukey’s box plots. *P < 0.05, **P < 0.01, and ***P < 0.001, by Friedman’s test (B), repeated-measures 2-way ANOVA with Holm-Šidák’s multiple-comparisons test (C–E), and Kruskal-Wallis test (G and H).

