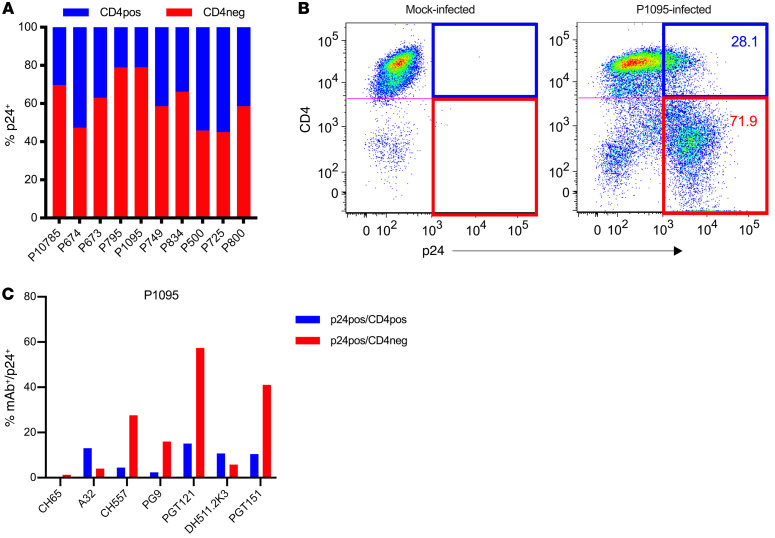
Figure 7. CD4 downregulation and its effect on antibody binding.
(A) Frequency of infected cells that express surface CD4 (CD4+p24+) and infected cells in which CD4 is downregulated (CD4–p24+) following infection with 10 LRVs. (B) Example of the gating strategy to determine p24+CD4+/– mock- or P1095 LRV–infected primary CD4+ T cells 72 hours after infection. CD4 expression is shown on the y axis and p24 on the x axis. The blue quadrant represents CD4+ infected cells (CD4+p24+), and the red quadrant represents CD4– infected cells (CD4–p24+). (C) The frequency of cells with antibody bound to their surface among CD4+p24+ (blue) and CD4–p24+ (red) P1095 LVR–infected cells.

