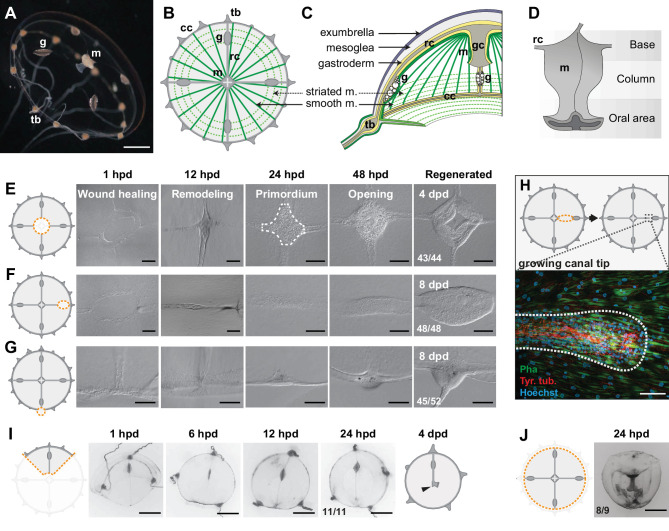
Figure 1. Regenerative potential of Clytia hemisphaerica jellyfish.
(A–D) Anatomy of Clytia jellyfish. (A) Swimming female jellyfish (m: manubrium; g: gonads; tb: tentacle bulbs). (B) Tetraradial body organization: each umbrella quadrant comprises a radial canal (rc), a gonad (g), and up to 16 tentacle bulbs (tb). The tetraradially-shaped manubrium (m) lies at the center. A peripheral circular canal (cc) connects the tentacle bulbs. Radial smooth muscle fibers (smooth m.) and circular striated muscles (striated m.) line the subumbrellar surface. (C) The umbrella comprises an epithelial exumbrella layer, a connective mesoglea, and a subumbrella layer, constituted by an inner layer associated with the mesoglea and two layers of muscle fibers (smooth and striated). (D) Diagram of the manubrium, lateral view, showing the oral (distal)-aboral (proximal) axis. The base comprises four gastric pouches, connected to the four radial canals. The oral area is organized into four folds (lips). (E–J) Regenerative potential of Clytia. In each cartoon the cut is indicated by an orange dotted line, removed parts are veiled. (E) Manubrium regeneration is completed in 4 days, the white dashed line at 24 hpd circles the cell accumulation. (F) Gonad regeneration over 8 days. (G) Tentacle bulb regeneration over 8 days. (H) Detail of the tip of a regrowing radial canal shown by fluorescence microscopy; neural fibers associated with the canal are stained with an anti-tyr-Tub antibody (red). (I) A quarter jellyfish fragment that morphed within 24 hr into a small jellyfish. A tiny new manubrium was visible after 4 days (arrowhead). (J) Fragment from which the entire bell margin had been removed: it sealed upon itself without further regeneration. Abbreviations: (dpd) days post-dissection, (hpd) hours post-dissection. Scale bars- A,I-J: 1 mm; E-G: 100 µm; H: 20 µm.


