. 2020 Sep 29;9:e53664. doi: 10.7554/eLife.53664

Figure 3. Subjects show a pro-variance bias in their choices on Narrow-Broad Trials, mirroring previous findings in human subjects.

(A) The narrow-broad trials include three types of conditions, where either the narrow stream is correct (brown), the broad stream is correct (blue), or the difference in mean evidence is small (grey, ‘Ambiguous’ trials). See Materials and methods and Figure 3—figure supplement 1 for details of the generating process. (B–C) Monkey choice performance on Narrow-Broad trials. (B) Subjects were significantly more accurate on ‘Broad-correct’ trials (Chi-squared test, chi = 99.05, p<1×10⁻¹⁰). Errorbars indicate the standard error. (C) Preference for the broad option on ‘Ambiguous’ trials. Subjects were significantly more likely to choose the broad option (Binomial test, p<1×10⁻¹⁰). Errorbar indicates the standard error. (D–E) Human choice performance on Narrow-Broad trials previously reported by Tsetsos et al., 2012. (D) Choice accuracy when either the narrow or the broad stream is correct, respectively. Subjects were more accurate on ‘Broad-correct’ trials. (E) Preference for the broad option on ‘Ambiguous’ trials. Subjects were more likely to choose the broad option.
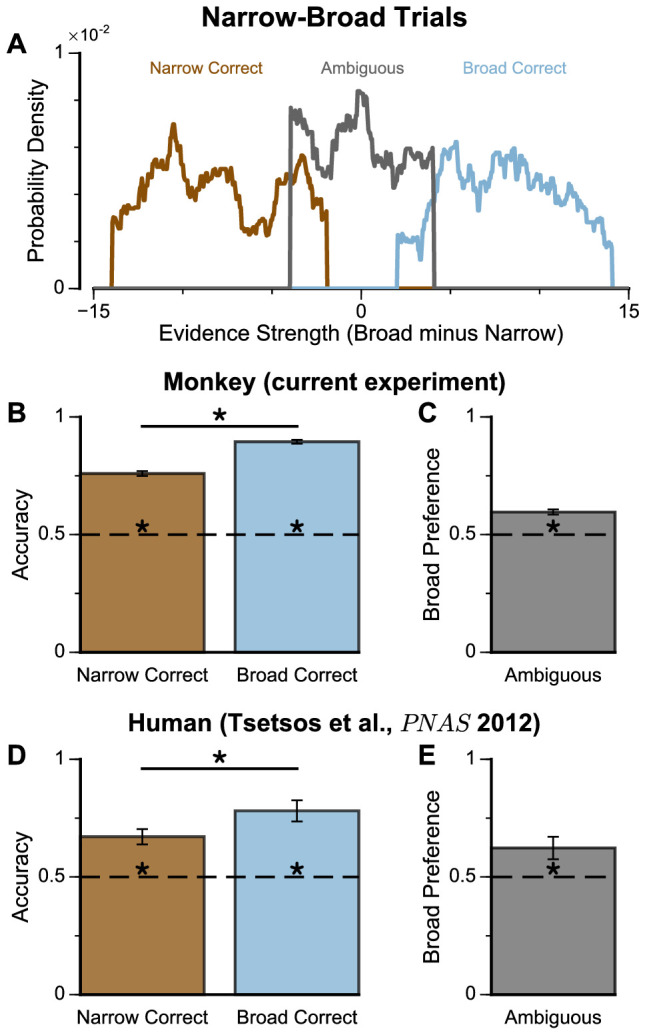
Figure 3.

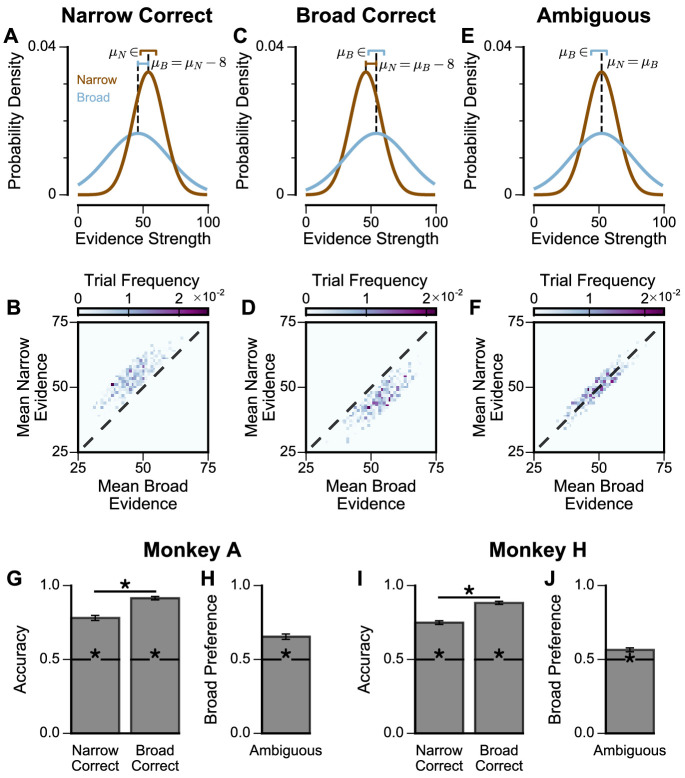
Figure 3—figure supplement 1. Extra Information on Narrow-Broad Trials, separated by subjects.

Figure 3—figure supplement 1.

(A) The generating process of the narrow-correct trials, for each narrow (brown) and broad (blue) stimuli sample. A full stream sequentially presents 8 such stimuli, each for 200ms with a 50ms inter-sample interval in between. In each trial where the narrow choice is correct, the generating mean of the narrow stream, μN, is uniformly sampled from [48,60]. The generating mean of the broad stream, μB, is then set to be μN8. For all trials, the generating standard deviation of the narrow and broad streams are σN=12, σB=24 respectively. The lines above the distributions denote the ranges of μN and μB. The particular values of μN and μB in this figure are shown for one trial, and chosen arbitrarily for illustration purpose. Given the generating means and standard deviations in a trial, a sequence of 8 stimuli samples are generated from a Gaussian process with certain constraints, for each of the narrow and broad options (See Materials and methods). (B) Sampled distribution of the mean evidence of the narrow and broad streams, across all trials for both monkeys where the narrow option is correct. (C, D) Same as (A, B) but for broad-correct trials. Here, μB is uniformly sampled from [48,60], and μN is set to be μB8. (E, F) Same as (A, B) but for ambiguous trials. Here, μN and μB are equal and uniformly sampled from [44,56]. (G) The accuracy of Monkey A in the narrow-correct and broad-correct trials. Monkey A was significantly more accurate on ‘Broad-correct’ trials (Chi-squared test, chi = 38.39, p = 5.80x10⁻¹⁰). Errorbars show the standard error. (H) The probability for Monkey A to choose the broad option in ambiguous trials. Monkey A was significantly more likely to choose the broad option (Binomial test, p < 1x10⁻¹⁰). (I) Same as (G) but for Monkey H (Chi-squared test, chi = 59.46, p < 1x10⁻¹⁰). (J) Same as (H) but for Monkey H (Binomial test, p = 3.00x10⁻⁶).

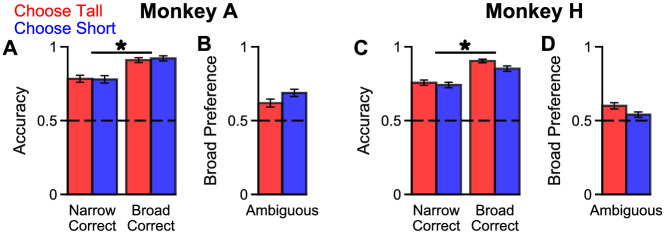
Figure 3—figure supplement 2. Extra Information on Narrow-Broad Trials, separated by ‘ChooseTall’ and ‘ChooseShort’ trials.

Figure 3—figure supplement 2.

The findings are very similar on ‘ChooseTall’ (red) and ‘ChooseShort’ (blue) trials. (A) The accuracy of Monkey A in the narrow-correct and broad-correct trials. Monkey A was significantly more accurate on ‘Broad-correct’ trials (Chi-squared test, chi(ChooseTall) = 18.66, p(ChooseTall) = 1.57×10⁻⁵, chi(ChooseShort) = 19.87, p (ChooseShort) = 8.30×10⁻⁶). Errorbars show the standard error. (B) The probability for Monkey A to choose the broad option in ambiguous trials. Monkey A was significantly more likely to choose the broad option (Binomial test, p(ChooseTall)=2.29×10⁻⁵, p (ChooseShort) = p < 10−10). (C) Same as (A) but for Monkey H (Chi-squared test, chi(ChooseTall) = 43.52, p(ChooseTall)=p < 10−10, chi(ChooseShort) = 16.19, p (ChooseShort) = 5.74×10⁻⁵). (D) Same as (B) but for Monkey H (Binomial test, p(ChooseTall)=3.47×10⁻⁶, p (ChooseShort) = 0.0314).