. 2020 Sep 29;9:e53664. doi: 10.7554/eLife.53664

Figure 5. Spiking cortical circuit model reproduces pro-variance bias.

(A) Circuit model schematic. The model consists of two excitatory neural populations which receive separate inputs (IA and IB), each reflecting the momentary evidence for one of the two stimuli streams. Each population integrates evidence due to recurrent excitation, and competes with the other via lateral inhibition mediated by a population of interneurons. (B) Example firing rate trajectories of the two populations on a single trial where option A is chosen. (C, D) Narrow-Broad Trials. (C) The circuit model is significantly more accurate when the broad stream is correct, than when the narrow stream is correct (Chi-squared test, chi = 1981, p<1×10⁻¹⁰). (D) On ‘Ambiguous trials’, the circuit model is significantly more likely to choose the broad option (Binomial test, p<1×10⁻¹⁰). (E–G) Regular trials. (E) The psychometric function of the circuit model when either the ‘Lower SD’ (brown) or ‘Higher SD’ (blue) stream is correct, respectively. (F) Regression analysis of the circuit model choices on regular trials, using evidence mean and variability as predictors of choice. Both quantities contribute to the decision-making process of the circuit model (Mean Evidence: t = 129.50, p<10−10; Evidence Standard Deviation: t = 45.27, p<10−10). (G) Regression coefficients of the stimuli at different time-steps, showing the time course of evidence integration. The circuit demonstrates a temporal profile which decays over time, similar to the monkeys. All errorbars indicate the standard error.

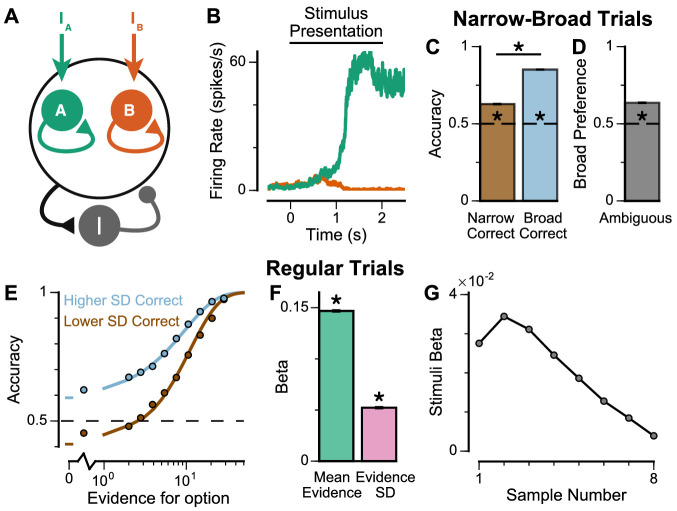
Figure 5.

Figure 5—figure supplement 1. Extended regression results on the circuit model performance.

Figure 5—figure supplement 1.

(A) Circuit model schematic. The model consists of two excitatory populations which receive separate inputs, reflecting evidence for the two stimuli streams. Each population integrates evidence due to recurrent excitation, and competes with the other due to lateral inhibition. (B) Regression analysis of the regular trial circuit model data, using the mean, maximum, minimum, first, and last evidence values of both the left and right streams, in order to evaluate the possibility of decision-making strategies alternative to evidence integration and pro-variance bias. Similar to the monkeys, the circuit model mainly relies on mean evidence to solve the task. See also Supplementary files 13 for cross-validation analysis comparing regression models including various combinations of these predictors. All errorbars indicate the standard error.
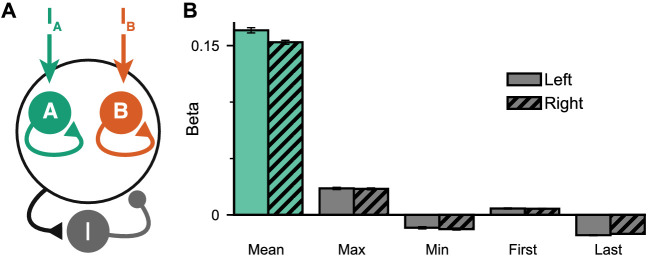
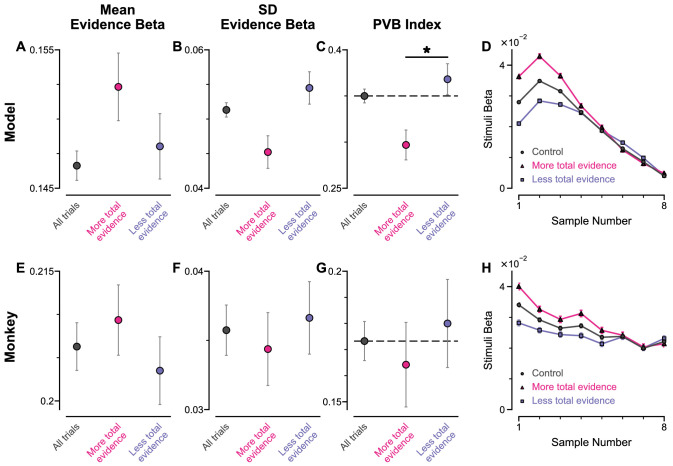
Figure 5—figure supplement 2. Pro-variance bias and temporal weightings in trials separated with more or less total evidence, for circuit model and monkey data.

Figure 5—figure supplement 2.

(A–C) Regression analysis of the circuit model choices, using evidence mean and variability as predictors, on all regular trials (grey), half of the regular trials with more total evidence (pink), and half of the regular trials with less total evidence (blue). (A) Regression coefficient for mean evidence. The regression coefficient for mean evidence is not significantly different between trials with more total evidence and trials with less total evidence (permutation test, p=0.8366). (B) Regression coefficient for evidence standard deviation. The regression coefficient for evidence standard deviation is not significantly different between trials with more total evidence and trials with less total evidence (permutation test, p=0.8710). (C) PVB index. The PVB index is significantly higher for trials with less total evidence than for trials with more total evidence (permutation test, p=7×10⁻⁵) (D) Temporal regression weights using the three sets of trials. (E–H) Same as (A–D) but using the monkey behavioural data. The regression coefficients for mean evidence and evidence standard deviation are not significantly different between trials with more total evidence and trials with less total evidence (permutation tests, p(mean evidence)=0.9452, p(evidence standard deviation)=0.9869). The PVB index tends to be higher for trials with less total evidence than for trials with more total evidence, but the effect is insignificant (permutation test, p=0.3677). All errorbars indicate the standard error.