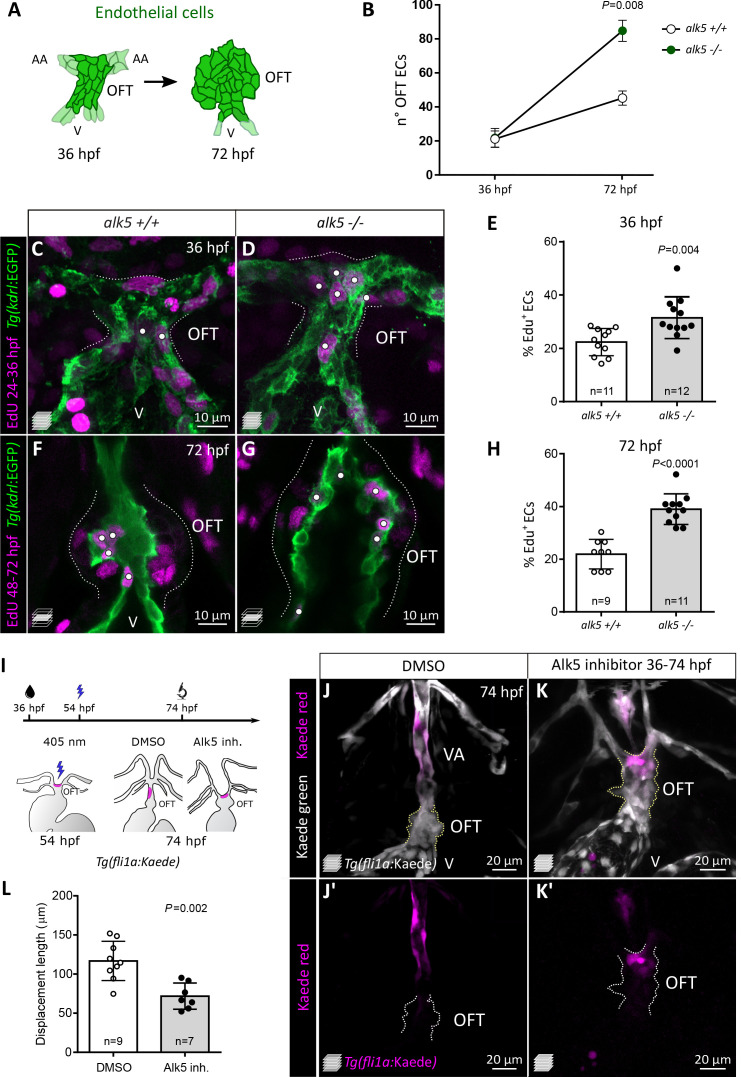
Figure 3. Alk5 restricts EC proliferation in the cardiac OFT and is required for ventral aorta formation.
(A) Schematics of OFT ECs at 36 and 72 hpf. (B) Quantification of EC number (darker cells shown in A) in 36 and 72 hpf alk5+/+ and alk5-/- OFTs (36 hpf: n = 11; 72 hpf: n = 6). (C–H) Confocal images (C, D, F, G) and quantification (E, H) of the percentage of EdU+ ECs in Tg(kdrl:EGFP) alk5+/+ and alk5-/- OFTs. Dotted lines outline the OFT; white dots mark EdU+ ECs. All the other EdU+ cells in the OFT region are kdrl:EGFP-. (I) Protocol used for photoconversion experiment. (J–K’) Confocal images of the OFT in 74 hpf Tg(fli1a:Kaede) larvae treated with DMSO or Alk5 inhibitor. Magenta, photoconverted ECs; dotted lines outline the OFT. (L) Quantification of the distance covered by photoconverted ECs between 54 and 72 hpf in DMSO and Alk5 inhibitor-treated larvae. (C, D, J–K’) Maximum intensity projections. (F, G) Single confocal planes. (B, E, H, L) Plot values represent means ± SD; p values from t-tests (E, H) or Mann Whitney (B, L). Scale bars: (C-G) 10 μm; (J–K’) 20 μm. See also Figure 3—figure supplement 1.


