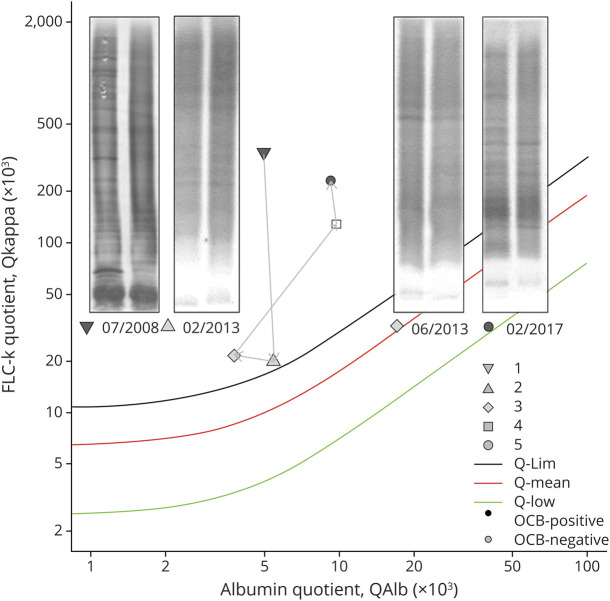
Figure 2. Data of FLC-k quotients of a patient with NMOSD in a double logarithmic FLC-k Reibergram.
See also the legend of figure 1. Inverted triangle: CSF analysis 07/2008 before immunotherapy, IF 95.1%; triangle: CSF analysis 02/2013 12 months after autologous-SCT, IF 12.5%; square: CSF analysis 06/2013, IF 34.5%; rectangle CSF analysis 02/2017, IF 77.8; circle CSF analysis 02/2017 IF 88.3% (new disease activity). FLC-k = free light chains kappa; IF = intrathecal fraction; neg = negative; NMOSD = neuromyelitis optica spectrum disease; OCB = oligoclonal band; pos = positive; Q = quotient; SCT = stem cell transplantation.

