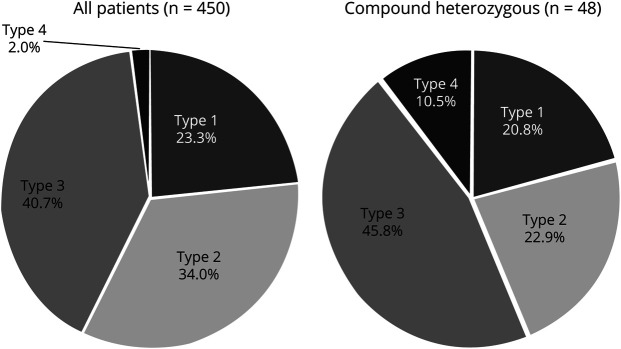
Figure 1. Prevalence of types of SMA.
Prevalence of types of SMA in the studied population (left chart) compared with the prevalence of SMA types in heterozygous patients (right chart). Note the significant increase in the proportion of patients with mild phenotypes (types 3 and 4) in the heterozygote group. SMA = spinal muscular atrophy.

