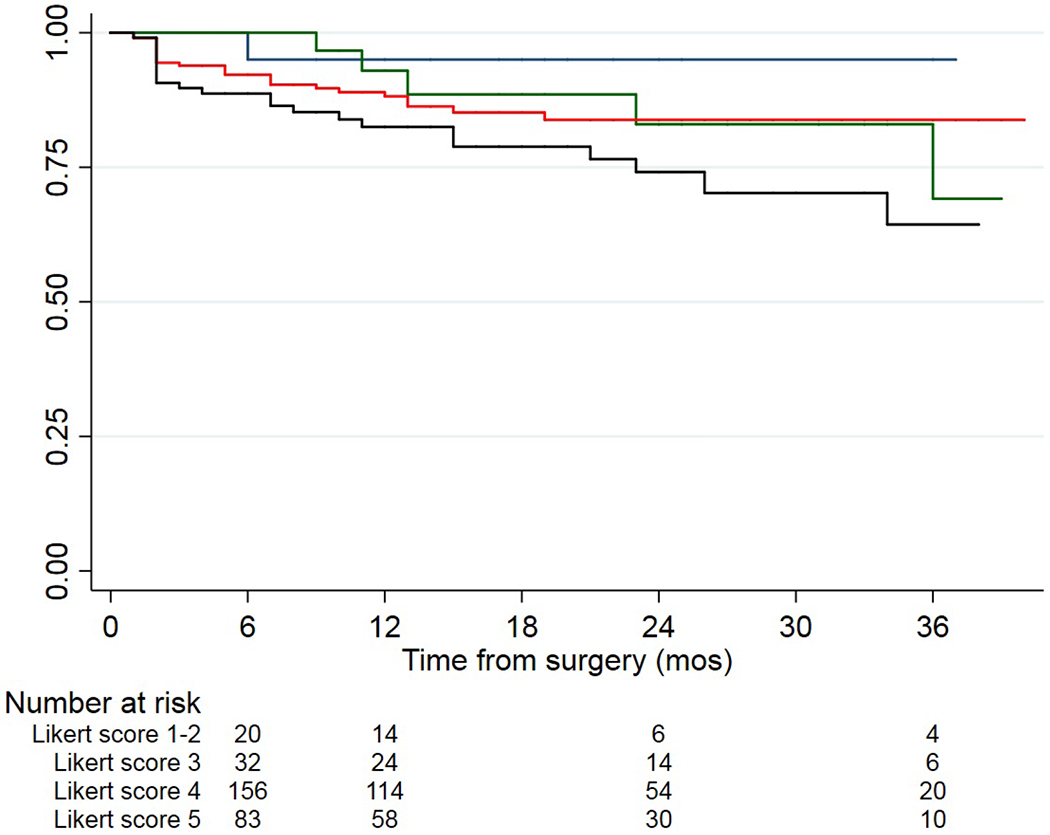
Figure 1-.

Kaplan-Meier curves showing disease-free survival stratified according to mpMRI score; the blue line represents patients with Likert 1-2 lesion; the green line represents patients with Likert 3 lesion; the red line represents patients with Likert 4 lesion; the black line represents patients with Likert 5 lesion.
