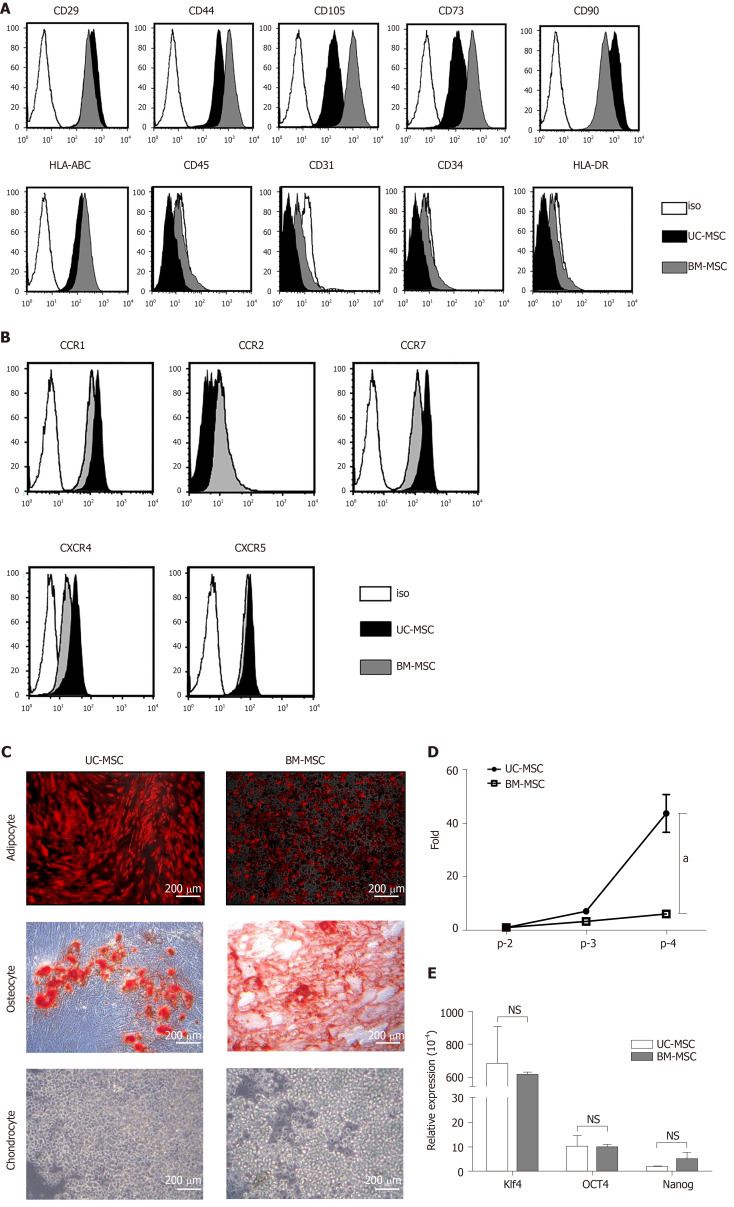
Figure 1.
Characterization of umbilical cord-derived mesenchymal stem cells and bone marrow-derived mesenchymal stem cells. A: Surface protein expression was analyzed using flow cytometry. Mesenchymal stem cells (MSCs) were assessed at the fourth passage; B: Chemokine receptor expression was analyzed at passages 3–7 by flow cytometry; C: Representative images of umbilical cord-derived MSCs and bone marrow-derived MSCs differentiation into adipocytes (bone marrow-derived MSCs: day 7; umbilical cord-derived MSCs: day 21), chondrocytes (day 21) and osteocytes (day 14). Scale bars: 200 μm. Adipocytes were detected by goat anti-mouse FABP4 polyclonal antibody under a fluorescence microscope. Osteoblasts and chondrocytes were stained with Alizarin Red S and Alcian Blue, respectively and observed under a light microscope; D: Growth rate of MSCs at different passages; and E: Pluripotency transcription factor expression levels of cultured MSCs measured by quantitative real-time polymerase chain reaction (target, GAPDH), D and E: Bone marrow-derived MSCs. Statistical analysis was performed by Student’s t-tests, aP < 0.05 vs indicated group. iso: Isotype; Klf4: Kruppel‐like factor 4; Nanog: Nanog homeobox; NS: No significance; OCT4: Octamer-binding transcription factor 4; UC-MSC: Umbilical cord-derived mesenchymal stem cells; BM-MSCs: Bone marrow-derived mesenchymal stem cells.

