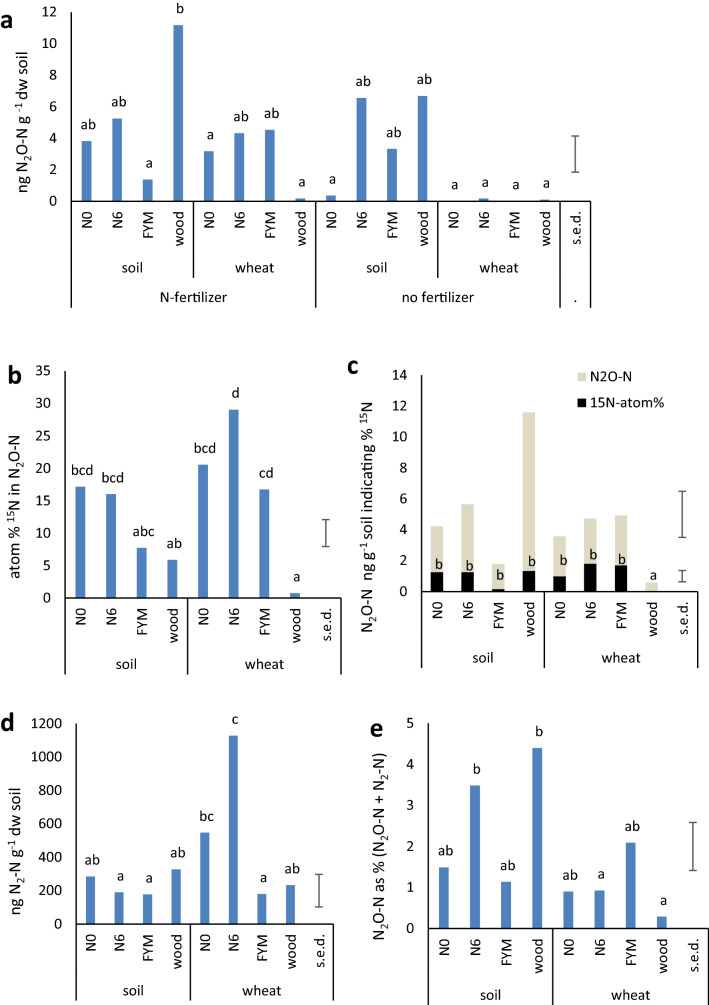
Figure 4.
Mean gas production over 4 days. (a) N2O-N, all treatments (48 pots); (b–e) K15NO3-fertilized treatments only (24 pots). (b) 15N atom % measured in N2O; (c) N2O-N indicating %15N (upper s.e.d. relates to N2O-N; lower bar relates to 15N atom %), (d) N2-N, (e) N2O-N as % (N2-N + N2O-N). Different letters denote significantly different values according to Tukey’s post-hoc test in ANOVA (P = 0.05), s.e.d. = standard errors of difference of means for all samples.

