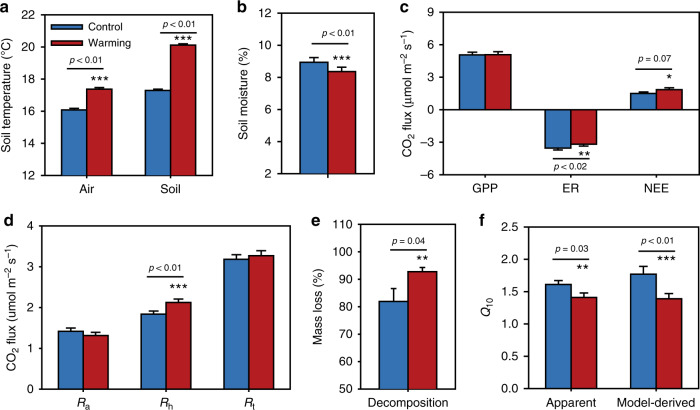
Fig. 1. Warming effects on soil variables and ecosystem C fluxes.
a Air and soil surface (7.5 cm) temperatures averaged from 2010 to 2016. b Soil moisture averaged from 2010 to 2016. c Ecosystem C fluxes, which were estimated on the basis of the C amount from CO2 emissions averaged from 2010 to 2016. GPP, gross primary productivity; ER, ecosystem respiration; NEE, net ecosystem C exchange. Positive values indicate C sink, and negative values represent C source. d in situ soil respirations averaged from 2010 to 2016. Ra, autotrophic respiration; Rh, heterotrophic respiration; Rt, soil total respiration. e Decomposition rate of standard cellulose filter paper (mass loss) in the field determined in 2016. f Apparent and model-derived temperature sensitivity (Q10) of heterotrophic respiration (Rh) averaged from 2010 to 2016. Apparent Q10 is estimated by fitting the curve of Rh versus soil temperature based on the Q10 method. Model-derived Q10 is derived by calibrating the MEND model. Error bars represent standard errors of the means (n = 4 field plots examined over seven repeated measures from 2010 to 2016). The differences between warming and control were tested by the two-sided repeated measures ANOVA, indicated by *** when p < 0.01, ** when p < 0.05, * when p < 0.10. Source data are provided as a Source Data file.

