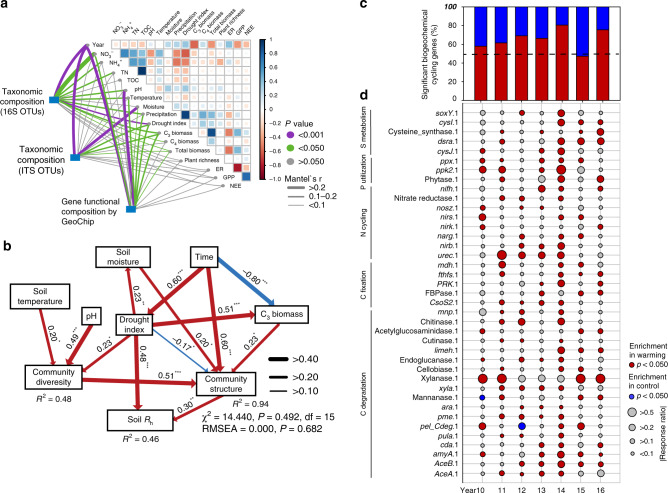
Fig. 2. Feedback mechanisms of soil microbial communities to warming.
a Pairwise comparisons of environmental factors with a color gradient denoting Pearson’s correlation coefficients. Taxonomic and functional community structures were related to each environmental factor by Mantel tests. Edge width corresponds to the Mantel’s r statistic for the corresponding distance correlations, and edge color denotes the statistical significance. b The structural equation model (SEM) showing causal relationships among environmental factors, diversity and structure of microbial functional community, and soil Rh. Red and blue arrows represent significant positive and negative pathways, respectively. Arrow width is proportional to the strength of the relationship and bold numbers represent the standard path coefficients. The p values based on 1,000 bootstrapping for path coefficients are indicated by *** when P < 0.001, ** when P < 0.01, * when P < 0.05. R2 indicates the proportion of the variance explained for each dependent variable in the model. c The relative proportion of significantly warming-stimulated and significantly warming-inhibited genes in biogeochemical cyclings according to GeoChip data. Dash line represents that the abundance of warming-stimulated (red) genes are equal to the abundance of warming-inhibited (blue) genes. Significance is based on response ratio of each gene with 95% confidence intervals. Biogeochemical cycling genes included all genes involved in C degradation, C fixation, N cycling, phosphorus (P) utilization and sulfur (S) metabolism. d Bubble plot illustrating the enrichment of key biogeochemical cycling genes under warming (W) and control (C) treatments according to GeoChip data. Bubble color represents the significance (p-value) of gene enrichment based on response ratios. Bubble size represents the relative changes of gene enrichment based on response ratios. The biogeochemical cycling processes for these genes are shown in plot, and the full names of the genes in this plot are listed in Supplementary Table 4.

