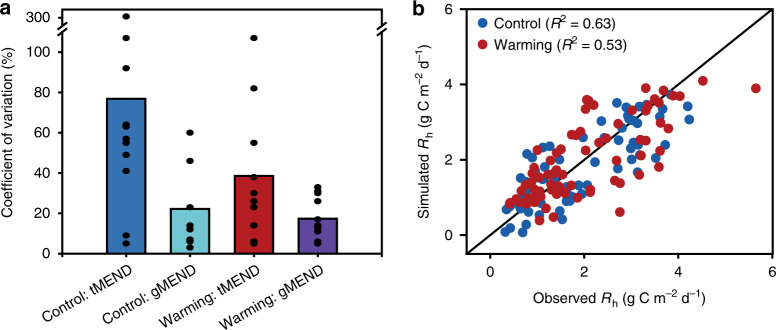
Fig. 3. Model parameter uncertainty and modeling performance.
a The MEND model parameter uncertainty quantified by the Coefficient of Variation (CV). The bars show the mean CV values of the 11 parameters (See Supplementary Fig. 12 and Supplementary Table 8 for detailed description). The dots along each bar show the CV for each parameter. The tMEND refers to the traditional MEND model parameterization without gene abundances data. The gMEND denotes the improved MEND parameterization with gene abundances. b Comparison between gMEND-simulated and observed heterotrophic respiration (Rh) under control and warming (R2 denotes the coefficient of determination).

