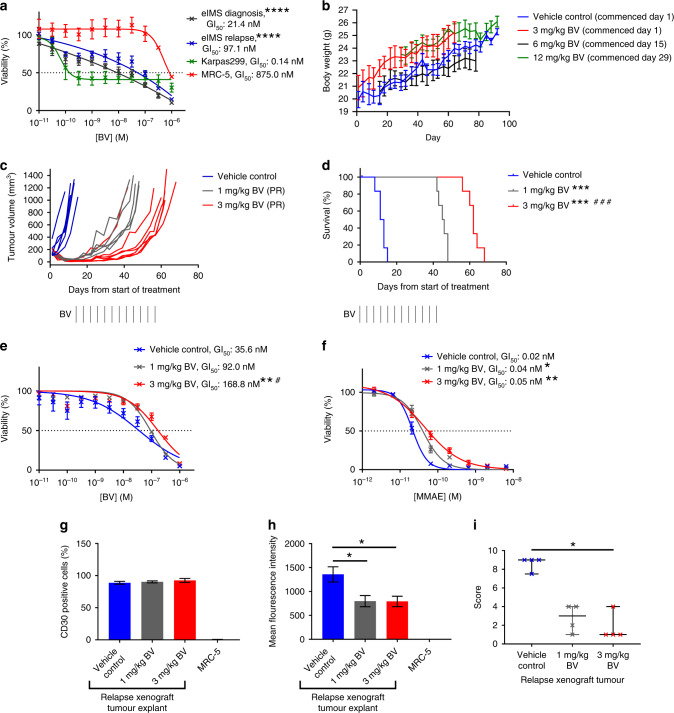
Fig. 2. eIMS cells and xenografts are sensitive to BV; however resistance develops during the treatment period.
a Resasurin cytotoxicity assay after 72 h BV treatment in eIMS-diagnosis and relapse cells (mean survival ± SEM from three independent assays, mean GI50 calculated by interpolation). Karpas299 was included as a positive control. ****: Comparison of eIMS to MRC-5, P < 0.0001 (one-way ANOVA with Tukey multiple-comparisons test). b Serial mouse weight (mean weight ± SEM)) during 6-week tolerability and toxicity studies of single-agent BV in non-tumour-bearing mice. c Tumour growth curves, PPTC objective response and d Kaplan–Meier survival of subcutaneous eIMS-relapse xenografts treated with 1 mg/kg or 3 mg/kg BV for six weeks (black vertical lines). ***: Comparison of BV treatment group to vehicle-control group, P < 0.001, and ###: comparison of BV treatment groups P < 0.001 (Mantel–Cox test). Resasurin cytotoxicity assay after 72 h of single cell suspensions of treated xenograft cells retreated with either e BV or f MMAE (mean viability ± SEM from three independent assays, mean GI50 calculated by interpolation). *: Comparison of BV treatment to vehicle control, *P < 0.05, **P < 0.01, and #: comparison of 3 mg/kg BV to 1 mg/kg BV, P < 0.05, (one-way ANOVA with Tukey multiple-comparisons test). g–i CD30 expression in treated xenografts. CD30 expression in early passage treated xenografts was quantified by flow cytometry to measure g the percentage of CD30-positive cells and h the mean fluorescent intensity of CD30 expression in vehicle control and BV-treated xenograft tumour cells (means ± SEM from three independent analyses). Xenograft cells were derived from two mice per treatment group. *: Comparison of BV treatment to vehicle control, P < 0.05, (one-way ANOVA with Tukey multiple-comparisons test). i Quantification of CD30 expression by IHC in formalin fixed xenograft tumours. CD30 expression was quantified by blinded scoring of the relative proportion and intensity of CD30 staining in ten fields of view from one tumour section per mouse. Staining intensity values are mean score ± SEM from two mice. *: Comparison of BV treatment to vehicle control, P < 0.05, (one-way ANOVA with Kruskal–Wallis and Dunn’s multiple-comparisons test).

