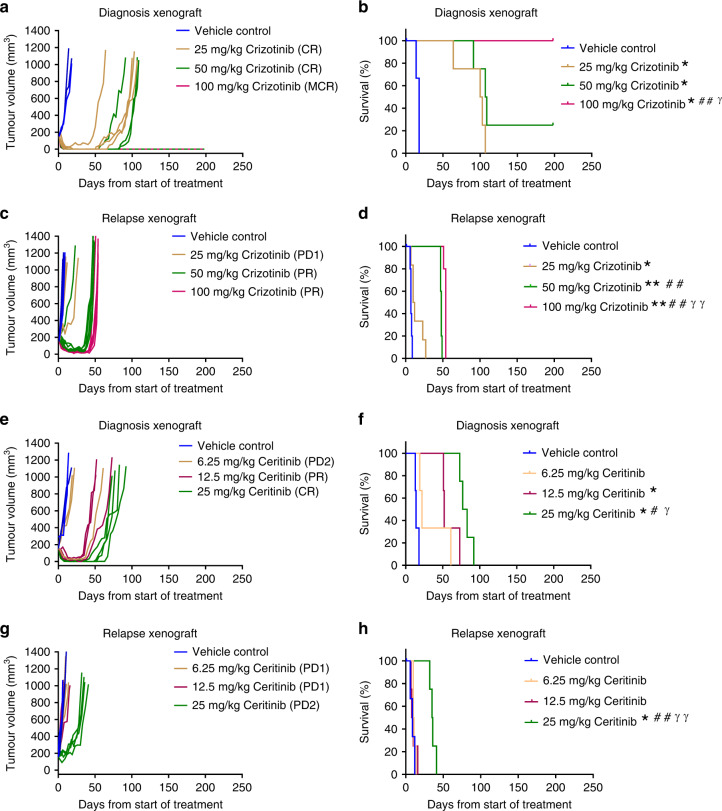
Fig. 4. Single-agent dose–response for ALKi in diagnosis and relapse eIMS xenografts.
Tumour growth curves, PPTC objective response and Kaplan–Meier survival analysis of diagnosis and relapse eIMS xenografts treated with a–d crizotinib or e–h ceritinib. Vehicle-control groups are three to six mice and treatment groups are four to six mice. *: Comparison of treatment group to vehicle-control group. #: Comparison to lowest dose treatment group. γ: Comparison of highest dose treatment group to middle dose treatment group. *P < 0.05, **P < 0.01, (Mantel–Cox Test).

