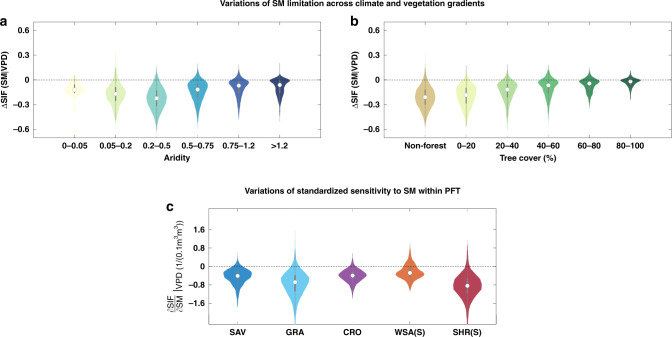
Fig. 5. Dependence of soil moisture dryness stress on climate and vegetation gradients.
Violin plots of soil moisture (SM) limitation effects (ΔSIF(SM|VPD)) across a aridity gradients and b tree cover gradients. c Violin plots of the sensitivity of solar-induced chlorophyll fluorescence (SIF) to SM (i.e., ) within different plant functional types: SHR(S), shrubland (south of 45° N); GRA, grassland; CRO, cropland; WSA(S), woody savanna (south of 45° N); SAV, savanna. White dots indicate the median values, gray boxes cover the interquartile range, and thin gray lines reach the 5th and 95th percentiles.

