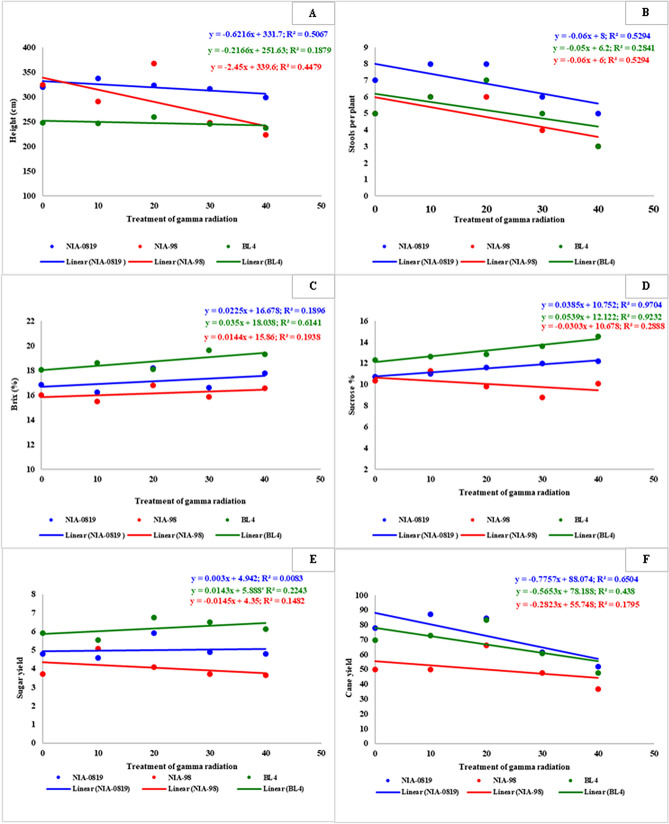
Figure 5.
Coefficient of determination for sugarcane height (A), stools per plant (B), Brix % (C), Sucrose % (D), sugar yield (E) and cane yield (F). Regression analysis of stomatal density against the doses of gamma radiation was conducted using Microsoft Office v. 2019. A similar trend was observed for cane yield of different genotypes; however, the degree of change varied. Sugar yield, on the other hand, showed an upwards trend for NIA-0819 and BL4 against a downwards trend for NIA-98.

