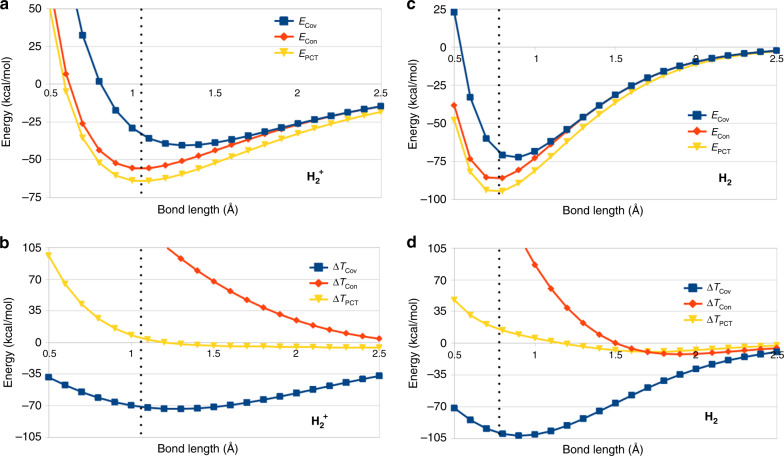
Fig. 1. Energy and kinetic energy changes for 1 and 2 e– H–H bonds.
a Energy decomposition (kcal/mol) for dissociation of H; energy terms are cumulative. b Kinetic energy decomposition (kcal/mol) for dissociation of H; kinetic energy changes, ΔT, are increments. c Energy decomposition (kcal/mol) for dissociation of H2. d Kinetic energy decomposition (kcal/mol) for dissociation of H2. Note that a majority of the binding energy occurs due to covalent (Cov) interaction (blue curves in a, c), accompanied by a significant KE lowering at the equilibrium geometry (vertical dots). The preponderance of the remaining binding energy is contributed by the contraction process, which is accompanied by a substantial increase in KE.

