Figure 1.
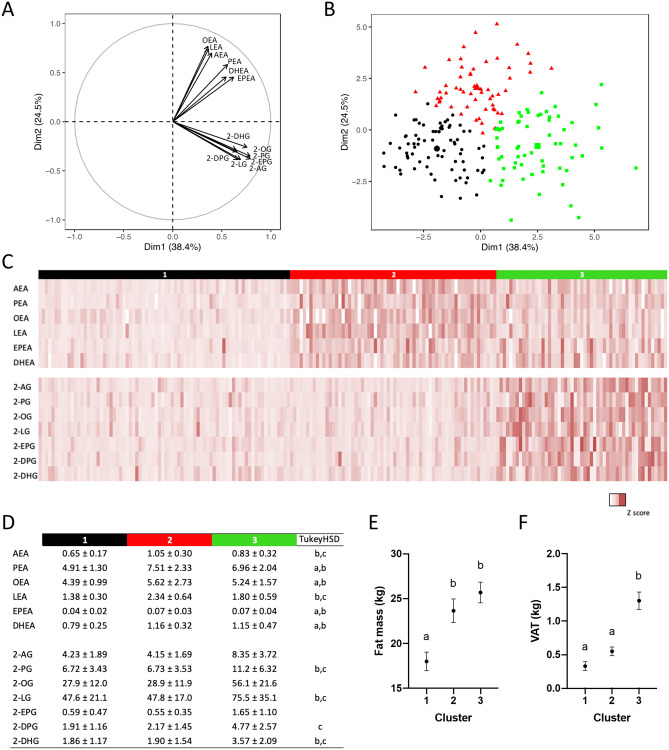
Hierarchical clustering based on principal component analysis (PCA) of circulating NAEs and 2‑MAGs (n = 195). (A) Loading plot of the principal component analysis including all circulating levels of NAEs and 2-MAGs. (B) PCA visualization of NAE and 2‑MAG profile for each individual. Colors indicate the 3 clusters determined using hierarchical clustering. (C) Heatmap representation of normalized levels of each NAE and 2‑MAG according to the clusters. (D) Mean ± SD of circulating NAEs and 2‑MAGs by clusters. Analysis of variance and Tukey HSD post hoc statistics are shown: (a) 1 vs 2; (b) 1 vs 3 and (c) 2 vs 3. (E) Fat mass (kg) and (F) visceral adipose tissue mass (kg) according to clusters with analysis of variance and Tukey post hoc test. Letters indicate significant differences between clusters (p < 0.05).

