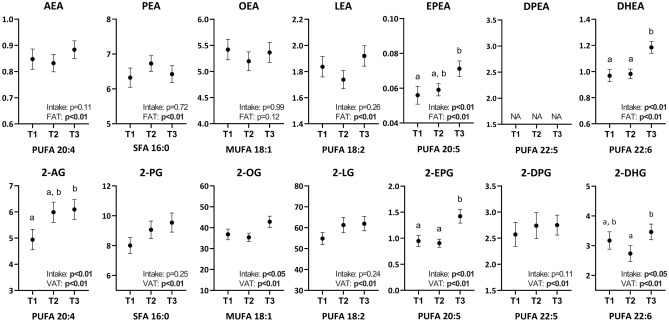
Figure 2.
Circulating NAE and 2‑MAG levels stratified by tertiles of self-reported fatty acid intakes. Values are mean ± SEM. Letters indicate significant differences between tertiles in analysis of variance and Tukey post hoc test (p < 0.05; n = 47 to 71 per tertile). Results of the generalized linear model including the mediators as the dependent variables and fat mass (NAEs) or visceral fat mass (2‑MAGs) as independent variables are included in each graph.

