Figure 3.
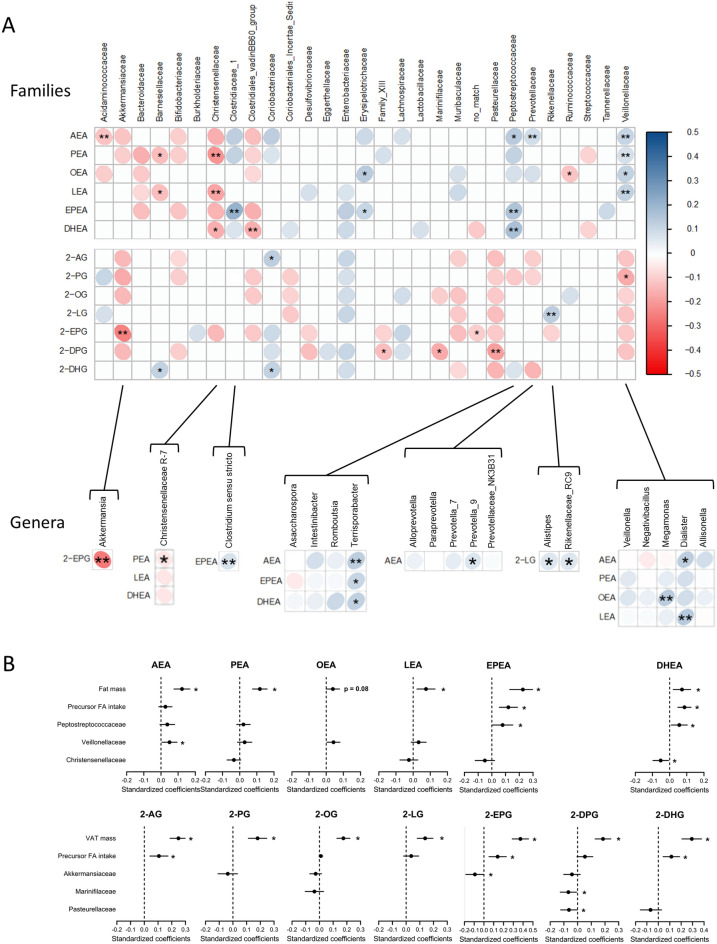
Circulating NAE and 2‑MAG levels association with gut bacterial taxa independent of adiposity measures. (A) Heatmap of Spearman's rank correlation coefficients of the relative abundances of gut microbiota taxa and the levels of circulating NAEs and 2‑MAGs. The analysis includes all gut microbiota families (Top) as well as the genera from families significantly associated with the mediators (Bottom). Circle color intensity represents the magnitude of the unadjusted correlation (Spearman rho coefficients). Blue circles indicate positive correlations and red circles negative correlations. Significant correlations following adjustment for total fat mass (NAEs) or visceral fat mass (2‑MAGs) are shown (*p < 0.1, **p < 0.05; n = 195). (B) Standardized regression coefficients of independent predictors of circulating NAE and 2-MAG levels. Results of the generalized linear model including the mediators as the dependent variables and fat mass (NAEs) or visceral fat mass (2‑MAGs) as independent variables are included in each graph. All bacterial families significantly associated to the mediator were considered in this analysis. All models also include the total or visceral fat mass as well as the dietary intake of the fatty acid precursor. Stepwise selection procedure was used to compute final models (*p < 0.05).

