Fig. 1.
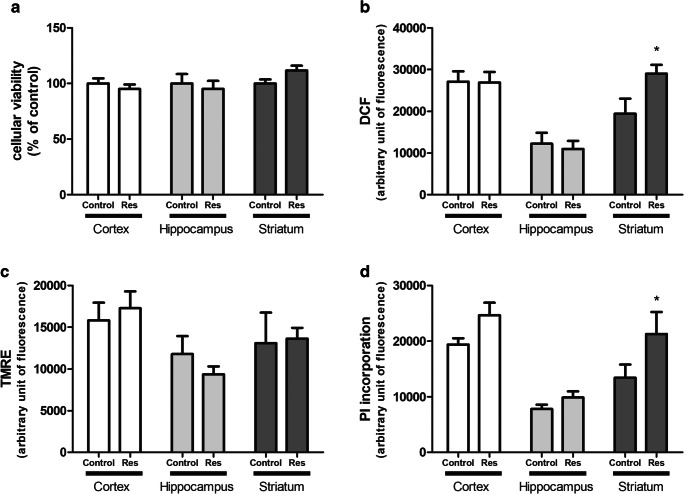
Evaluation of reserpine (Res, 1 mg/kg) neurotoxicity in cortical, hippocampal, and striatal slices. a Cellular viability measured by MTT reduction, expressed as percentage of control. b ROS measurement through fluorescence of DCF dye. c Evaluation of mitochondrial membrane potential with TMRE fluorescent dye. d Membrane integrity evaluation due to PI incorporation. Fluorescence data are shown as arbitrary fluorescent unit. Results are presented as means ± SEM (*P < 0.05 vs control; Student’s t test; n = 7)

