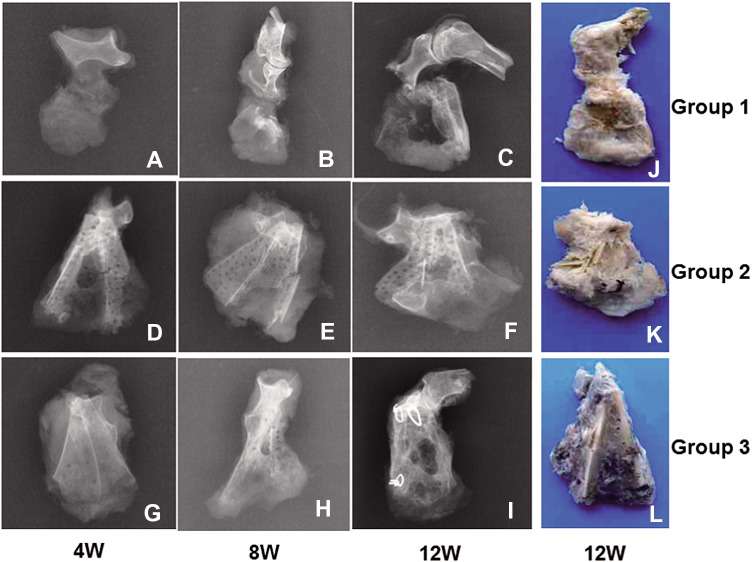
Fig. 4.
X-ray radiographic and macroscopic observation. Top row (A–C) represents X-ray radiographs of scapular defect repair in Group 1 at 4, 8 and 12 weeks respectively. The 2nd row (D–F) represents X-ray radiographs of scapular defect repair in Group 2 at 4, 8 and 12 weeks respectively. The 3rd row (A–C) represents X-ray radiographs of scapular defect repair in Group 3 at 4, 8 and 12 weeks respectively. The 4th column (J–L) represents macroscopic views of scapular defect repair in Group 1, 2, and 3, respectively, at 12 weeks

