Fig. 3.
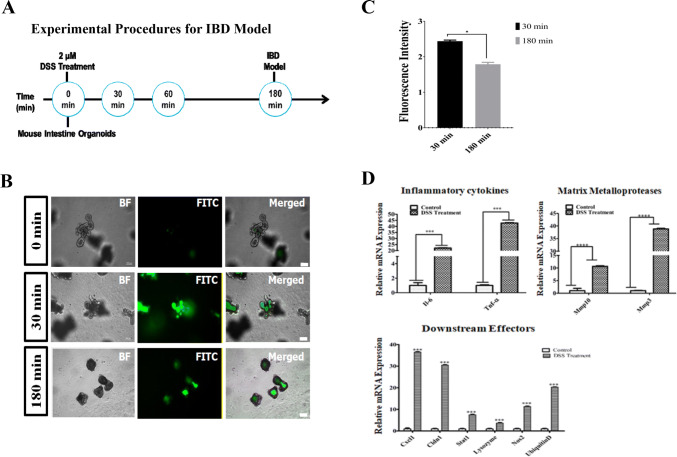
Dextran sodium sulfate (DSS) induced barrier injury and qRT-PCR evaluation. A Schematic diagram showing development of the inflammatory model. B The DSS inflammatory organoid model loss of barrier function using FITC-dextran 4 kDa uptake. At the beginning of the experiment (0 min), no damage was found in organoid and observed FITC uptake (upper row). Following, no significant decline in FITC concentration (middle row) after 30 min of DSS treatment, but the FITC concentration was notably lower in the luminal space of the organoids after 180 min of treatment (bottom row). Scale bar: 100 μm. C Graph showing the quantitative difference in FITC intensity at 30 min and 180 min of post DSS treatment, data were normalized using bright field image. D The qRT-PCR analyses showing higher expression of pro-inflammatory cytokines TNF-α and IL-6 in the DSS treatment (left panel). Similarly, matrix metalloproteases MMP10 and MMP3 expressions were higher due to inflammation of the treated sample compared to normal conditions (middle panel). Downstream effectors of inflammation, such as chemokine receptor ligand CXCL1, reactive oxygen species marker (NOS2), proteome degrading ubiquitin D, tight junction protein CLDN1, and paneth cell marker lysozyme, are significantly more highly expressed in the treated sample. The values are the means plus the standard error of mean (S.E.M), and a p value < 0.05 (*) (< 0.0001***) was significant

