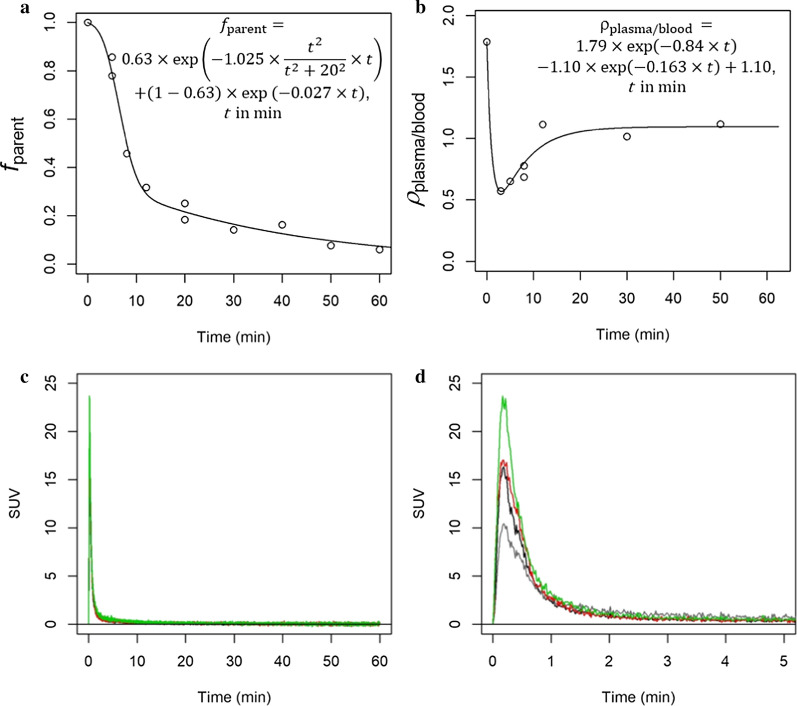
Fig. 5.
Generation of the input function. a Radioactivity fraction of parent tracer in plasma over time. b Ratio of activity concentration between plasma and whole blood over time. Lines are fit functions according to Eqs. 1 and 2, respectively, and as shown in the graphs. c Generated normalized (SUV) input functions of the 3 scans with blood coincidence measurements. d as c, emphasizing the first 5 min. Black, red, green, input functions; grey (lowest peak), whole blood SUV corresponding to the black input function (second lowest peak)

