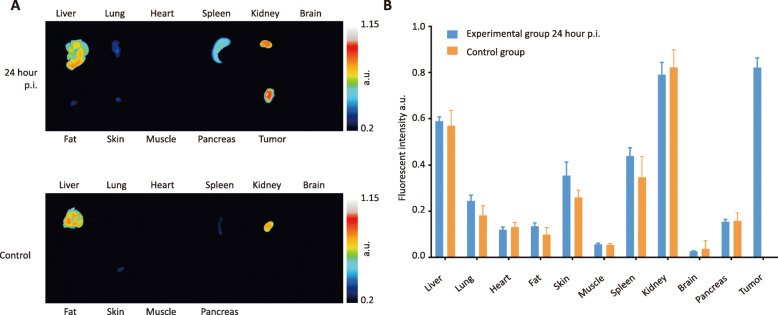
Fig. 3.
Comparable pattern in VGT-309 organ biodistribution between the experimental mice (24 h post injection group) and the control mice. a Representative fluorescent images of tissues from the experimental mice (upper panel) and the control mice (lower panel). b Quantitative fluorescent signal of a. n = 6. Data are presented as mean ± standard error. An independent Student’s T test did not find significant differences between groups

