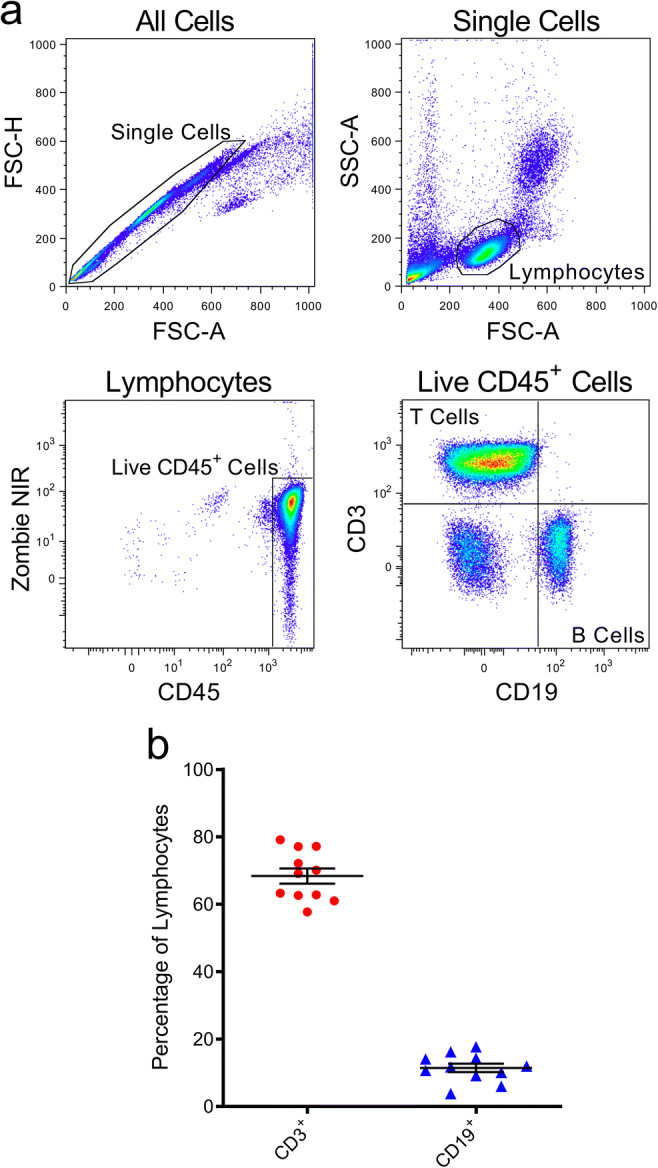
Fig. 1.

Proportions of T and B cells in freshly isolated PBMCs. a, b PBMCs, freshly isolated by Ficoll-Paque density gradient centrifugation, were labelled with fluorochrome-conjugated mAbs and data acquired by flow cytometry. a Sequential flow cytometric gates were selected left to right (top to bottom), as shown, to gate single cells, lymphocytes, and live (Zombie NIR−) CD45+ lymphocytes, in order to determine b proportions of CD3+CD19− T cells and CD3−CD19+ B cells amongst CD45+ cells. Data represents group means ± SD (n = 11 donors); symbols represent individual donors
