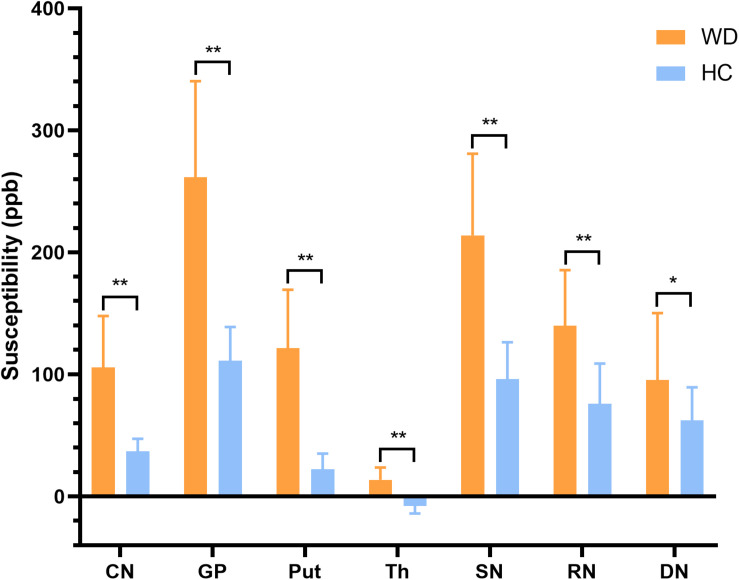
FIGURE 3.
Comparison of mean susceptibility values of DGM between WD patients and HC. Susceptibility values of all examined DGM were higher in WD patients than in HC. *P < 0.05, and **P < 0.01. Error bars indicate standard deviation. CN, head of the caudate nucleus; DN, dentate nucleus; GP, globus pallidus; Put, putamen; RN, red nucleus; SN, substantia nigra; Th, thalamus.

